. 2022 Oct;54(10):1514-1526.
doi: 10.1038/s41588-022-01179-9. Epub 2022 Sep 22.

Single-cell multi-omics of human clonal hematopoiesis reveals that DNMT3A R882 mutations perturb early progenitor states through selective hypomethylation

Affiliations

Single-cell multi-omics of human clonal hematopoiesis reveals that DNMT3A R882 mutations perturb early progenitor states through selective hypomethylation

Anna S Nam et al. Nat Genet. 2022 Oct.

Abstract

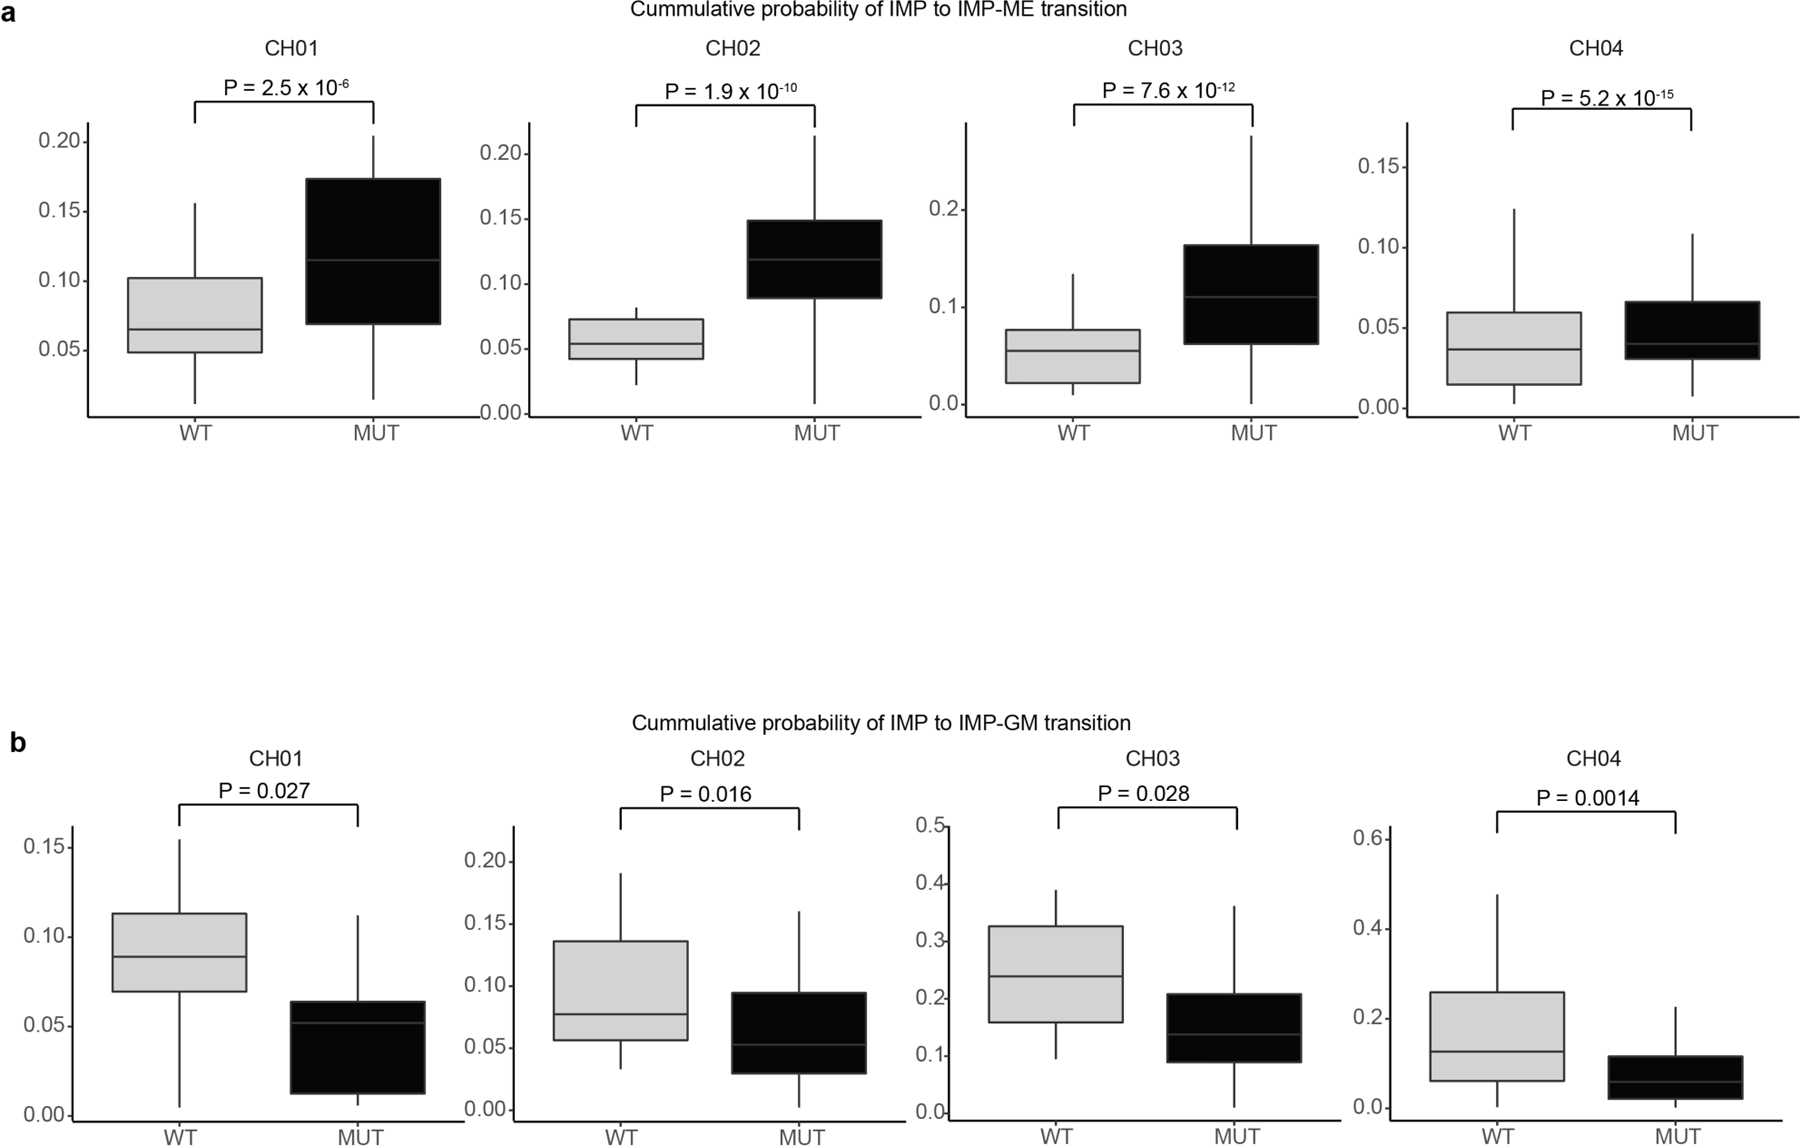
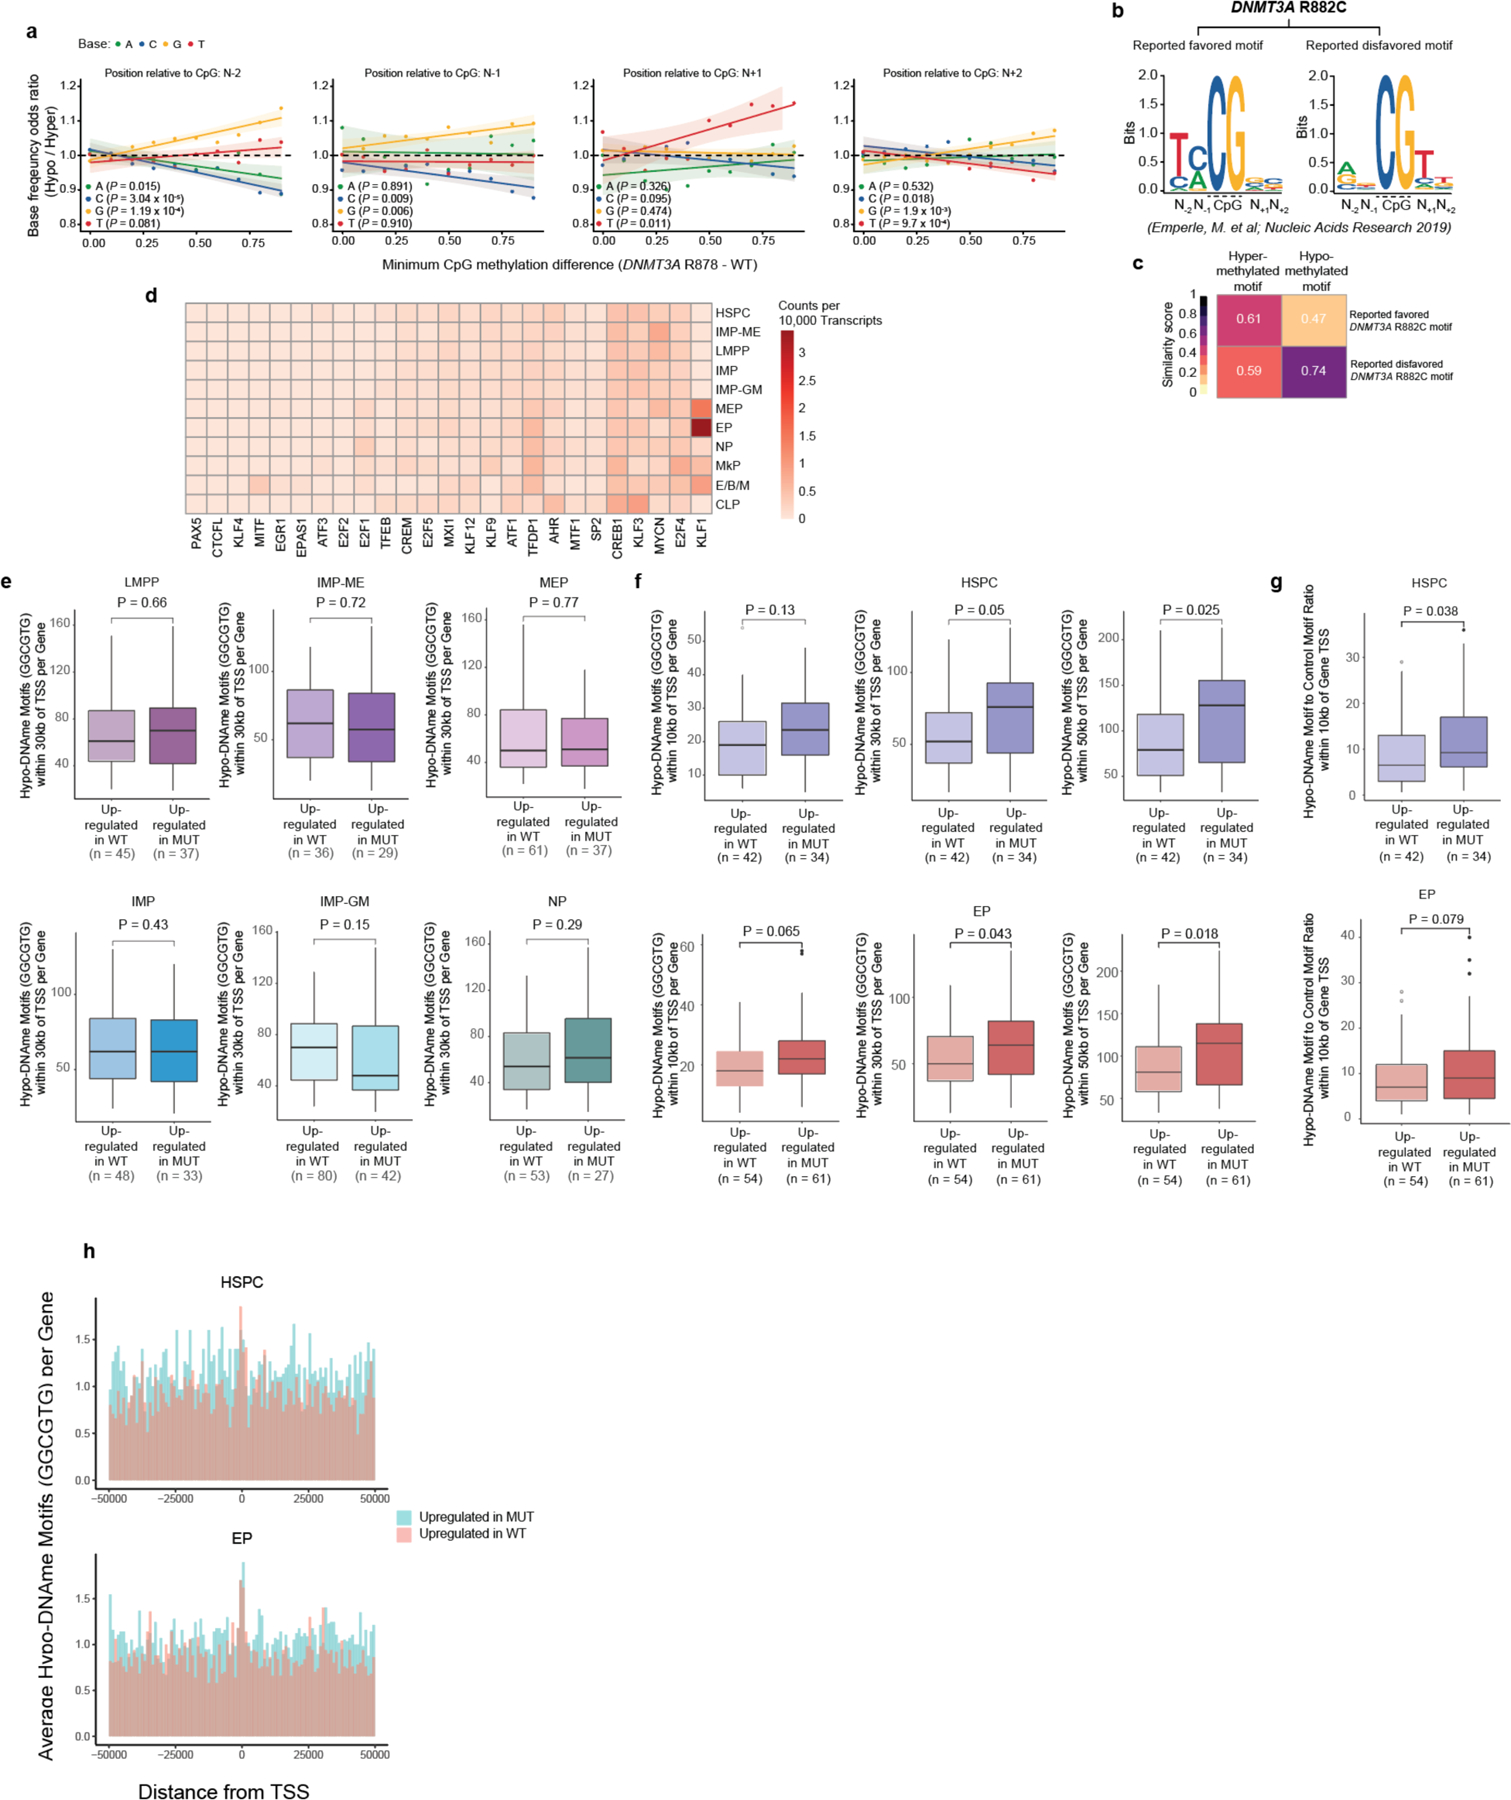
Somatic mutations in cancer genes have been detected in clonal expansions across healthy human tissue, including in clonal hematopoiesis. However, because mutated and wild-type cells are admixed, we have limited ability to link genotypes with phenotypes. To overcome this limitation, we leveraged multi-modality single-cell sequencing, capturing genotype, transcriptomes and methylomes in progenitors from individuals with DNMT3A R882 mutated clonal hematopoiesis. DNMT3A mutations result in myeloid over lymphoid bias, and an expansion of immature myeloid progenitors primed toward megakaryocytic-erythroid fate, with dysregulated expression of lineage and leukemia stem cell markers. Mutated DNMT3A leads to preferential hypomethylation of polycomb repressive complex 2 targets and a specific CpG flanking motif. Notably, the hypomethylation motif is enriched in binding motifs of key hematopoietic transcription factors, serving as a potential mechanistic link between DNMT3A mutations and aberrant transcriptional phenotypes. Thus, single-cell multi-omics paves the road to defining the downstream consequences of mutations that drive clonal mosaicism.


Conflict of interest statement

Competing interests

O.A.-W. has served as a consultant for H3B Biomedicine, Foundation Medicine Inc, Merck, Pfizer, and Janssen, and is on the Scientific Advisory Board of Envisagenics Inc and AIChemy; O.A.-W. has received prior research funding from H3B Biomedicine and LOXO Oncology unrelated to the current manuscript. I.G. serves on the advisory board of Bristol Myers Squibb, Takeda, Janssen, Sanofi and GlaxoSmithKline. D.A.L. has served as a consultant for Abbvie and Illumina, and is on the Scientific Advisory Board of Mission Bio and C2i Genomics; D.A.L. has received prior research funding from BMS and Illumina unrelated to the current manuscript.

Figures

Extended Data Figure 1.
Extended Data Figure 1.. GoT captures genotyping information of thousands of CD34+ cells in scRNA-seq.
a, Summary of GoT data from CH patient samples with DNMT3A R882 mutations. b, Number of genes per cell (left) and number of UMIs per cell (right) from CD34+ sorted hematopoietic progenitors by patient sample after QC filters. c, DNMT3A R882 mutant fraction of single cells determined by GoT versus DNMT3A R882 mutation variant allele frequencies (VAF) in bulk sequencing of matched unsorted stem cell product. d, Fraction of cells by number of DNMT3A UMIs in standard 10x Genomics data without genotyping information (left), DNMT3A UMIs with R882 locus coverage in standard 10x data (middle), and DNMT3A UMIs with R882 locus coverage in GoT amplicon library (right). e, Species-mixing experiment data in which mouse cells (Ba/F3) with a human mutant CALR transgene were mixed with human cells (UT-7) with a human wildtype CALR transgene. Mouse and human genome alignment of 10x data with genotyping data from GoT pre (top) and post (bottom) implementation of UMI consensus assembly based on Levenshtein distance (online methods). f, Number of duplicate reads supporting cell barcode-UMI pair in the GoT library that is identified in the 10x gene expression (GEX) library as a DNMT3A gene (left), no gene (middle), or a non-DNMT3A gene (right).
Extended Data Figure 2.
Extended Data Figure 2.. Copy number analysis of wildtype and mutant single cells from clonal hematopoiesis patient samples with DNMT3A R882 mutations.
a, Heatmap of relative expression of genes ordered by chromosome/chromosomal position following copy number variation analysis using the InferCNV package. Cells (y-axis) are stratified by patient and DNMT3A R882 genotype status. b, Heatmap of relative expression of Y-chromosome genes following copy number variation analysis and cell stratification as in a.
Extended Data Figure 3.
Extended Data Figure 3.. Integration of DNMT3A R882 mutation and assignment of progenitor subsets in clonal hematopoiesis patient samples.
a, UMAP of CD34+ progenitor cells from samples CH01-CH04 after integration using the Seurat package (online methods). b, Heatmap of top 10 differentially expressed genes for progenitor subsets. c, Lineage-specific genes (left) and modules from Velten et al. (right, Supplementary Table 2) are scored and projected onto the UMAP representation of CD34+ cells. d, UMAP of CD34+ cells overlaid with cluster assignments, split by patient sample.
Extended Data Figure 4.
Extended Data Figure 4.. Classification of IMPs showing lineage biases and pseudotime analysis between mutated and wildtype cells.
a, UMAP of CD34+ cells, overlaid with cluster assignment of all IMP subsets in the dataset. b, Neutrophil and Megakaryocytic-Erythroid lineage specific gene module scores from Velten et al. compared across the three IMP clusters. P-value was calculated from Wilcoxon rank sum test. c, UMAP of CD34+ cells overlaid with mutation status for WT, DNMT3A R882 mutant (MUT), or unassigned (NA), split by genotype for all samples (top) and by patient sample (bottom). d, UMAP with projected pseudotime values (top left). Pseudotime comparison between WT and MUT cells for all samples (top right) and for individual samples (bottom) as estimated by Monocle. P-value was calculated from likelihood ratio test of linear mixed model with/without mutation status for aggregate analysis (online methods, top) and Wilcoxon rank sum test for individual samples (bottom).
Extended Data Figure 5.
Extended Data Figure 5.. Cell cycle module expression comparison between mutated and wildtype progenitor cells.
a, Cell cycle module score represents the union of S-phase and G2M-phase gene-module expression (Supplementary Table 2). P-value was calculated from likelihood ratio test of linear mixed model with/without mutation status (online methods). Analysis was performed for clusters with at least 200 genotyped cells across all patient samples.
Extended Data Figure 6.
Extended Data Figure 6.. Transition probabilities via RNA velocity reveals a megakaryocytic-erythroid bias of IMPs.
a, Single cell mean IMP → IMP-ME and b, IMP → IMP-GM transition probabilities, as measured via RNA velocity, between wildtype or DNMT3A R882 mutant IMPs for each sample. P-values from Wilcoxon rank-sum test.
Extended Data Figure 7.
Extended Data Figure 7.. Comparison of differential expression analysis between permutation test and linear mixed model and MYC gene expression.
a, P-values from permutation test and linear mixed model (online methods) are plotted per gene. Correlation coefficient R calculated using Pearson’s Correlation. P-values derived from Student’s t-distribution. b, Normalized MYC gene expression between mutated and wildtype cells in MEP and EP. P-value was calculated from likelihood ratio test of linear mixed model with/without mutation status (online methods).
Extended Data Figure 8.
Extended Data Figure 8.. Multi-omics single cell methylome, transcriptomic, and somatic genotyping reveals hypomethylation of PRC2 targets in DNMT3A R882 CH.
a, UMAP dimensionality reduction (n = 528 cells) based on scRNA-seq data (Smart-seq2) after integration and batch correction of six plates (online methods). b, UMAP dimensionality reduction showing cluster gene markers for the transcriptome data. c, Number of CpG sites captured per cell after quality filtering (online methods). The metrics for each sample according to enzymatic digestion with Msp1 (Single) or Msp1 plus HaeIII (Double) are shown. d, Average single cell methylation at all regions (global, double digest), promoters, introns or exons. P-values from likelihood ratio test of LMM with/without mutation status (online methods). e, Average single cell methylation at CpH (i.e. CpA, CpC or CpT) sites. f, Average single cell methylation at 269 hypomethylated promoters identified with DMR analysis (shown in Fig. 4e, promoters with P-value < 0.05 and at least −5% methylation change) in CH02 and CH04. g, Average single cell methylation at SUZ12 (top panel) and EZH2 (bottom panel) ENCODE ChIP-seq peaks intersected with bivalently H3K27me3, H3K4me3-marked regions in CD34+ cells for CH02 and CH04. P-values from likelihood ratio test of LMM with/without mutation status. h, Normalized expression of PRC2 target genes with preferentially hypomethylated TSS (from Fig. 4e) in GoT data of WT versus MUT cells by progenitor subtype. P-values from likelihood ratio test of LMM with/without mutation status. i, Comparison of average methylation values for TSS ± 1 kb regions in normal HSPCs and DNMT3A WT (n = 6) versus DNMT3A R882, NPM1 mutated acute myeloid leukemia (AML; n = 7) samples in regions without (left) or with (right) PRC2 ChIP-seq peaks, controlling for CpG content. j, Comparison of average methylation values for promoter regions in WT (n = 122) versus DNMT3A R882 mutated AML (n = 9) samples from TCGA in regions without (left) or with (right) PRC2 ChIP-seq peaks, controlling for CpG content.
Extended Data Figure 9.
Extended Data Figure 9.. Motif enrichment at hypomethylated CpGs and hypomethylated motif enrichment in regions around differentially expressed genes.
a, Base frequency odds ratio of hypo- versus hyper-methylated CpG flanking sequences at positions N-2, N-1, N+1, and N+2. The odds ratios were derived from base frequencies of flanking positions of the CpG sites hypo- or hyper-methylated in mutant versus wildtype cells above the thresholds shown in the x axis for minimum absolute CpG methylation difference (Pearson correlation, P-values derived from F-test). b, Reported motif logos derived from Emperle et al. for either hypomethylated (disfavored) or hypermethylated (favored) sites for DNMT3A R882 compared to its wildtype counterpart (left). c, Similarity scores between the reported and our de novo DNMT3A R882 hypo- and hypermethylated motifs as measured by correlation coefficients of the position weight matrices for the respective motifs excluding the CpG dinucleotide. d, Heatmap of expression of transcription factors with binding motif similarity >0.5 compared to hypomethylated motif of DNMT3A R882 (that do not meet the overall expression threshold, Fig. 5a). e, Frequencies of DNMT3A R882 hypomethylated motif within 30kb of TSS of the differentially expressed genes between MUT and WT cells in progenitor subsets. P-values were calculated by Wilcoxon rank sum test. f, Frequencies of DNMT3A R882 hypomethylated motif within 10 kb, 30 kb or 50 kb of TSS of the differentially expressed genes between MUT and WT cells in HSPCs and EPs. P-values were calculated by Wilcoxon rank sum test. g, Ratio of frequencies of DNMT3A R882 hypomethylated motif to those of the control shuffled motif with CpG (Fig. 5e) within 10 kb of TSS of the differentially expressed genes between MUT and WT cells in HSPCs and EPs. P-values were calculated by Wilcoxon rank sum test. h, Average per-gene incidence of DNMT3A R882 hypomethylated motif within 50kb of TSS by distance from TSS for differentially expressed genes between MUT and WT cells in HSPCs (top) and EPs (bottom).
Extended Data Figure 10.
Extended Data Figure 10.. Single nucleus ATAC-seq of Dnmt3a R878H Lin-, c-Kit+ progenitors reveals enhanced accessibility of R882 hypomethylated motif and TF motifs with high similarity scores to the hypomethylated motif.
a, Distribution of fragment size in snATAC-seq data of Dnmt3a R878H and wildtype Lin-, c-Kit+ progenitors (n = 3 in each cohort). b, TSS enrichment of accessible fragments as a function of unique fragments per cell. c, UMAP of integrated datasets Dnmt3a R878H and wildtype Lin-, c-Kit+ progenitors, displayed per sample (n = 3 in each cohort). d, Heatmap of gene accessibility scores for differentially accessible progenitor identity marker genes across progenitor subsets. e, Scatterplot of similarity scores of mouse TF motifs versus human TF motifs to the R882-hypomethylated motif (Pearson’s correlation, P-value derived from F-test). f, Binding motifs of mouse and human TFs with high similarity score to the R882-hypomethylated motif and expression in HSPCs (Fig. 5b, HOCOMOCO v11). g, FWER-adjusted P-values for accessibility changes between wildtype and Dnmt3a R878H cells by progenitor identities for hypo-methylated motif and shuffled motifs controls (with and without CpG), as well as motif accessibility deviation of the TFs identified Fig. 5b (related to Fig. 5f). h, Accessibility of PRC2 targets between wildtype and Dnmt3a R878H and wildtype Lin-, c-Kit+ progenitor subsets.
Extended Data Figure 11.
Extended Data Figure 11.. Integration of CH05 and control bone marrow CD34+ scRNA-seq data and assignment of progenitor subsets.
a, UMAP of CD34+ progenitor cells from samples CH05 and samples BM01–05 after integration using the Seurat package (online methods). b, Number of genes per cell (top) and number of UMIs per cell (bottom) from CD34+ hematopoietic progenitors by patient sample after QC filters and down-sampling to equivalent geometric means of UMIs per patient. c, Heatmap of top 10 differentially expressed genes for progenitor subsets. d, UMAP representation of CD34+ cells showing cell marker gene expressions. e, Modules from Velten et al. (Supplementary Table 2) are scored and projected onto the UMAP representation of CD34+ cells.
Extended Data Figure 12.
Extended Data Figure 12.. Bone marrow clonal hematopoiesis patient sample confirms results from CH01-CH04.
a, Per-patient comparison of megakaryocytic-erythroid module scores in control bone marrow versus CH05 IMPs (Supplementary Table 2). Cell number downsampled to the same number (n = 132 cells per sample). P-values were calculated from likelihood ratio test of LMM with/without CH status. b, Per-patient comparison of granulocytic-monocytic module scores in control versus CH IMPs (Supplementary Table 2). P-values were calculated from likelihood ratio test of LMM with/without CH status. c, Fraction of IMP-ME cells out of all biased IMP (IMP-ME + IMP-GM) cells in control versus CH populations. P-value was calculated from one-sample t-test. d, Per-patient comparison of module scores for differentially down- or up-regulated genes in mutant DNMT3A HSPCs (identified in GoT data, Fig. 3a,c) in control versus CH HSPCs. P-values were calculated from likelihood ratio test of LMM with/without CH status. e, Per-patient comparison of module scores for differentially down- or up-regulated genes in mutant DNMT3A EPs (identified in GoT data, Fig. 3a,c) in control versus CH EPs. P-values were calculated from likelihood ratio test of LMM with/without CH status. f, Module scores for genes upregulated in at least 2 cell types (identified in GoT data, Fig. 3b) in control versus CH cells of major cell types. P-values from likelihood ratio test of LMM with/without CH status. g, Fraction of control BM or CH05 cells in EP1 versus EP2 cell clusters. h, UMAP of CH05 cells (clustered independently of the control BM samples) with progenitor cell assignments. i, UMAP of CH05 cells with genotyping data for WT (n = 397 cells) and DNMT3A R882 mutant (MUT; n = 290 cells). j, Normalized expression of differentially upregulated genes in at least 2 cell types, highlighted in Fig. 3b in wildtype versus mutated cells in CH05. k, UMAP of CH05 cells with protein expression (CITE-seq) and gene expression for CD38 and CD9. l, UMAP of CH05 cells highlighting HSPCs, IMP-ME, and MkPs (left) included in the comparison of CD9 expression in wildtype versus mutated cells (right).
Extended Data Figure 13.
Extended Data Figure 13.. Single nucleus ATAC-seq data from bone marrow clonal hematopoiesis reveals enhanced accessibility of hypomethylated motif in mutated erythroid progenitors.
a, Distribution of fragment size in snATAC-seq data of patient CH05 with DNMT3A R882 CH. b, TSS enrichment of accessible fragments as a function of unique fragments per cell. c, Heatmap of the gene accessibility scores for cluster marker genes (FDR < 0.01 and Log2FC > 1) by cell cluster. d, Pseudotime trajectories for either erythroid (left, n = 1,843 cells) or lymphoid (right, n = 1,740 cells) differentiation. e, Difference between hypomethylated and shuffled motif accessibility z-scores across either erythroid (n = 1,843 cells) or lymphoid (n = 1,740 cells) pseudotime trajectory quartiles. P-values were calculated by Wilcoxon rank sum test. HSPC, Hematopoietic stem and progenitor cell; IMP-ME, immature myeloid progenitor with megakaryocytic/erythroid bias; IMP-GM, immature myeloid progenitor with granulocyte/monocyte bias; LMPP, Lymphoid-myeloid pluripotent progenitor; MkP, Megakaryocyte progenitor; NP, Neutrophil progenitor; CLP, Common lymphoid progenitor; Pre-B1/2, Pre-B cell; EP1/2, Erythroid progenitor.
Figure 1.
Figure 1.. Genotyping of Transcriptomes demonstrates co-mingling of mutated and wildtype cells in DNMT3A R882-clonal hematopoietic differentiation.
a, Schematic of GoT workflow. UMI, unique molecular identifier; UTR, untranslated region. b, Uniform manifold approximation and projection (UMAP) of CD34+ cells (n = 27,324 cells) from clonal hematopoiesis samples (n = 4 individuals), overlaid with cluster assignment (left); projections of cell cycle gene module scores (top right) or uncommitted hematopoietic stem cell (HSC) associated gene modules (bottom right, Supplementary Table 2). c, UMAP of CD34+ cells (n = 27,324 cells) with projected mutation status assignment for WT (n = 4,641 cells), DNMT3A R882 mutant (MUT; n = 1,789 cells) or unassigned (NA; n = 20,894 cells). d, Percent of genotyped cells per cluster for all samples (bars) and for each patient sample (points) (top) and normalized gene expression of DNMT3A per cluster (bottom). HSPC, hematopoietic stem progenitor cells; IMP, immature myeloid progenitors; IMP-ME, megakaryocytic-erythroid biased IMP; IMP-GM, granulo-monocytic biased IMP; LMPP, lympho-myeloid primed progenitors; CLP, common lymphoid progenitor; MEP, megakaryocytic-erythroid progenitors; E/B/M, eosinophil, basophil, and mast cell progenitors; EP, erythroid progenitor; MkP, megakaryocytic progenitor; NP, neutrophil progenitor; WT, wildtype; MUT, mutant; NA, not assignable.
Figure 2.
Figure 2.. DNMT3A R882 mutated CH cells demonstrate distinct differentiation biases at key junctures.
a, UMAP highlighting multi-lineage lympho-myeloid primed progenitors (LMPPs) and common lymphoid progenitors (CLPs); UMAP showing analytically isolated and re-clustered LMPPs and CLPs, showing branch point of divergence into myeloid versus lymphoid primed progenitors (left middle); UMAP showing the cell density of DNMT3A R882 MUT and WT cells (left bottom). The normalized frequency of mutant cells in subclusters for aggregate analysis of samples CH01-CH04 with mean ± s.d. of 100 downsampling iterations to 1 genotyping UMI per cell (right, downsampling performed to control for potential greater ability to detect the mutant heterozygous allele in cells with higher DNMT3A expression, see online methods). The heatmap at the bottom depicts representative lineage-specific genes for individual clusters. P-value was calculated from likelihood ratio test of LMM with/without cluster identity. b, Normalized frequency of DNMT3A R882 mutant cells in progenitor subsets with at least 200 genotyped cells. Bars show aggregate analysis of samples CH01-CH04 with mean ± s.d. of 100 downsampling iterations to 1 genotyping UMI per cell. Points represent mean of n = 100 downsampling iterations for each sample. Heatmap depicts representative lineage-specific genes for individual progenitor subsets. c, Megakaryocytic-erythroid module scores in wildtype versus mutant IMPs (Supplementary Table 2). P-value was calculated from likelihood ratio test of LMM with/without mutation status. d, Fraction of IMP-ME cells out of all biased IMP (IMP-ME + IMP-GM) cells in wildtype versus DNMT3A R882 mutant populations. P-value was calculated from proportions test. e, -Log10(P-value) of cell cycle module scores enriched in mutated versus wildtype progenitor subsets (Extended Data Fig. 5a). P-values were calculated from likelihood ratio test of LMM with/without mutation status. f, RNA velocity field vectors overlaid on UMAP, demonstrating differentiation trajectories computed via scVelo (online methods). g, Schematic representation of the transition probabilities between HSPCs and IMP subsets from samples CH01-CH04 (right). Odds ratios (OR) were calculated as the ratio between DNMT3A R882 MUT and WT transition probabilities, as measured using RNA velocity. Single cell mean IMP → IMP-ME or IMP → IMP-GM transition probabilities between wildtype or DNMT3A R882 mutant cells, inset. P-values were calculated from likelihood ratio test of LMM with/without mutation status (see Extended Data Fig. 6 for per-sample data). HSPC, hematopoietic stem progenitor cells; IMP, immature myeloid progenitors; IMP-ME, megakaryocytic-erythroid biased IMP; IMP-GM, granulo-monocytic biased IMP; LMPP, lympho-myeloid primed progenitors; CLP, common lymphoid progenitor; MEP,megakaryocytic-erythroid progenitors; E/B/M, eosinophil, basophil, and mast cell progenitors; EP, erythroid progenitor; MkP, megakaryocytic progenitor; NP, neutrophil progenitor; WT, wildtype; MUT, mutant; NA, not assignable.
Figure 3.
Figure 3.. Differential gene expression analysis between mutated and wildtype cells reveals markers of lineage aberrancies and dysregulated MYC activity.
a, Differentially expressed (DE) genes between DNMT3A R882 mutant and wildtype hematopoietic stem progenitor cells (HSPC) via permutation test (online methods). Genes highlighted in red represent DE genes overlapping with 58 genes upregulated on acute myeloid leukemia stem cells (LSC) compared to normal HSCs (P = 9.3 × 10⁻⁵). P-value was calculated by hypergeometric test. b, Heatmap of upregulated genes in DNMT3A mutant cells compared to wildtype cells, in at least two cell clusters (P < 0.05, permutation test). Histograms show numbers of upregulated genes in each cluster (top) and numbers of clusters per upregulated gene (left). Next to the genes are listed putative TFs (TRANSFAC) with black indicating the TFs that overlap for more than one recurrent DE gene. c, Differentially expressed genes between DNMT3A R882 mutant and wildtype EPs via permutation test. Pathway enrichment of MSigDB CGP gene sets shows enrichment of Benporath MYC MAX targets (FDR-adjusted P-value = 0.01) and Coller MYC targets (FDR-adjusted P-value = 0.01, see Supplementary Table 4 for complete gene set enrichment results against the MSigDB CGP dataset). P-values were calculated from hypergeometric test with FDR (Benjamini-Hochberg) correction. d, Local regression of normalized expression levels as a function of pseudotime of MYC/MAX targets (differentially upregulated in Fig. 3c) for WT and DNMT3A R882 mutant (MUT) cells. Shading denotes 95% confidence interval. Histogram shows cell density of clusters included in the analysis, ordered by pseudotime.
Figure 4.
Figure 4.. DNMT3A R882 promotes selective hypomethylation of PRC2 targets in human hematopoiesis.
a, Schematic representation of the single-cell multi-omics platform that captures methylome, transcriptome, and somatic genotype status. b, UMAP dimensionality reduction (n = 528 cells) showing the assigned progenitor identities (left) or the assigned genotype (right) from available samples CH02 and CH04. (c-d) Average single cell methylation at CpG islands c, and enhancers d, from double digest experiments (online methods). P-values from likelihood ratio test of LMM with/without mutation status. e, Differentially methylated promoters between wildtype and DNMT3A R882 mutant hematopoietic progenitors. P-values from generalized linear model (GLM) to account for global hypomethylation in DNMT3A mutated cells and identify regions of preferential hypomethylation (online methods). Red dots indicate significantly hypomethylated Benporath PRC2 and EED target genes (MSigDB C2: CGP gene sets). f, Differentially hypomethylated ChIP-seq peaks (ENCODE hg38 Tf clusters) ranked by P-value. P-values from a GLM to account for global hypomethylation in DNMT3A mutated cells and identify regions of preferential hypomethylation. g, Single cell average methylation at ChIP-seq peaks (ENCODE hg38 Tf clusters intersected with bivalent peaks (H3K27me3, H3K4me3) from human CD34+ hematopoietic progenitor cells) for either SUZ12 (left) or EZH2 (right). P-values from likelihood ratio test of LMM with/without mutation status. h, Comparison of AML samples with/without DNMT3A R882 showing DNMT3A mutant-to-wildtype ratio of methylation at TSS overlapping PRC2 ChIP-seq peaks or non-overlapping CpG rich TSS as control. P-value from two-sided Wilcoxon rank sum test. HSPC, hematopoietic stem progenitor cells; IMP, immature myeloid progenitor; NP, neutrophil progenitor; M/D, monocytic/dendritic cell progenitors; EP, erythroid progenitor; WT, wildtype; MUT, mutant; NA, not assignable.
Figure 5.
Figure 5.. DNMT3A R882 displays flanking sequence specificity associated with MYC binding motif.
a, Motif logo for the odds ratio of base frequency of the flanking positions (N-1, N-2, N+1, N+2) of CpG sites. Odds ratios were calculated based on the flanking regions of CpG sites hypomethylated or hypermethylated in DNMT3A R882 mutant compared with wildtype hematopoietic progenitors (online methods). b, Similarity score between the hypomethylated motif of DNMT3A R882 (Fig. 5a) and TF binding motifs in the HOCOMOCO v11 collection of human TF binding motifs. Relevant transcription factors with expression level in CD34+ cells > 0.5 (counts per 10,000 transcripts; Smart-seq2) and motif similarity > 0.5 are labeled. c, Frequencies of DNMT3A R882 hypomethylated motif within 30 kb of TSS of the differentially expressed genes between MUT and WT cells in HSPCs and EPs (identified in GoT data, Fig. 3a,c, see Extended Data Fig. 9e for other progenitor subsets, Extended Data Fig. 9f for 10 kb and 50 kb of TSS, Extended Data Fig. 9g for data accounting for CpG content, Extended Data Fig. 9h for CpG density centered at TSS of differentially expressed genes). P-values were calculated by Wilcoxon rank sum test. d, UMAP dimensionality reduction of murine wildtype (n = 3 mice) and Dnmt3a R878H (n = 3 mice) Lin, Kit+ snATAC-seq data showing progenitor cluster annotation and representative progenitor gene marker accessibility (n = 46,496 cells). e, UMAP showing accessibility deviation as calculated with chromVar for hypomethylated motif (left) and shuffled motif (right, z-scores). f, Bonferroni FWER-adjusted P-values for accessibility changes between wildtype and Dnmt3a R878H cells by progenitor identities for hypomethylated motif and negative control shuffled motifs (with/without CpG), as well as binding motifs of the TFs identified in Fig. 5b. g, Similarity between binding motifs of all TFs plotted in Fig. 5b and the hypomethylated motif of DNMT3A R882 as a function of FWER-adjusted P-value rank for accessibility changes between wildtype and Dnmt3a R878H cells by progenitor identities. Rank calculated as follows: -log10(FWER-adjusted P-value) * sign((MUT-WT) accessibility)). Correlation coefficient R calculated using Pearson’s Correlation. P-value derived from Fisher’s Z transform. h, Comparison of single cell average methylation of ARNT binding motifs (intersected with ARNT ChIP-seq peaks, ENCODE hg38 Tf clusters) between wildtype and DNMT3A R882 mutant hematopoietic progenitor cells. P-values from likelihood ratio test of LMM with/without mutation status. i, Comparison of single cell average methylation of MYC binding motifs (intersected with MYC ChIP-seq peaks, ENCODE hg38 Tf clusters) between wildtype and DNMT3A R882 mutant hematopoietic progenitor cells. P-values from likelihood ratio test of LMM with/without mutation status. j, Relative expression per cell (AUC) of MYC downstream targets inferred using the SCENIC package (online methods) as a function of average MYC motif methylation. Correlation coefficient R calculated using Pearson’s Correlation. P-value derived from GLM. HSPC, hematopoietic stem progenitor cells; MP, multipotent progenitors; IMP, immature myeloid progenitors; LMPP, lympho-myeloid primed progenitors; CLP, common lymphoid progenitor; EP, erythroid progenitor; MkP, megakaryocytic progenitor; NP, neutrophil progenitor; MP, monocytic progenitor.
Figure 6.
Figure 6.. Bone marrow clonal hematopoiesis progenitor cells display megakaryocytic-erythroid differentiation bias, MYC target gene expression, and enhanced accessibility for the R882 hypomethylated motif.
a, UMAP of CD34+ cells (n = 44,782 cells) for scRNA-seq data from a clonal hematopoiesis sample (CH05) and previously published five control bone marrow samples, (BM01–05), labeled with cluster assignments. b, UMAP of CD34+ cells (n = 44,782 cells) labeled with CH (n = 5,770) or control (n = 39,082) status. c, Megakaryocytic-erythroid module scores in control versus CH IMPs (left, Supplementary Table 2) granulocytic-monocytic module scores in control versus CH IMPs (right, Supplementary Table 2). P-values were calculated from likelihood ratio test of LMM with/without CH status. d, Module scores for differentially down- or up-regulated genes in mutant DNMT3A HSPCs and EPs (identified in GoT data, Fig. 3a,c) in control versus CH HSPCs and EPs. e, Local regression of normalized expression levels as a function of pseudotime of MYC/MAX targets (differentially upregulated in Fig. 3c) for control and DNMT3A R882 CH cells. Shading denotes 95% confidence interval. Histogram shows cell density of clusters included in the analysis, ordered by pseudotime. Boxplot shows comparison of module scores between control and CH cells within the two EP clusters. P-value calculated from likelihood ratio test of LMM with/without CH status. f, UMAP dimensionality reduction of CD34+ cells (n = 3,824 cells) for snATAC-seq data from a clonal hematopoiesis sample (CH05) depicting the cell cluster assignment and cell type labels. g, Motif accessibility z-scores for shuffled, hypo-methylated motif and relevant transcription factors for the HSPC cluster (n = 788 cells). P-values correspond to Wilcoxon rank sum test between accessibility of the shuffled motif and the indicated motif. h, UMAP projection of genotype assignment for WT (n = 135 cells) and MUT (n = 160 cells). i, Motif accessibility z-score comparison for either hypo-methylated or shuffled motifs between WT (n = 135 cells) and MUT (n = 160 cells). P-values were calculated by Wilcoxon rank sum test. HSPC, Hematopoietic stem and progenitor cell; IMP-ME, immature myeloid progenitor with megakaryocytic/erythroid bias; IMP-GM, immature myeloid progenitor with granulocyte/monocyte bias; LMPP, Lymphoid-myeloid pluripotent progenitor; MkP, Megakaryocyte progenitor; NP, Neutrophil progenitor; CLP, Common lymphoid progenitor; Pre-B1/2, Progenitor B-cells; EP1/2, Erythroid progenitor.

Comment in

  • Multi-omics on our multitudes.
    Voit RA, Sankaran VG. Voit RA, et al. Nat Genet. 2022 Oct;54(10):1449-1450. doi: 10.1038/s41588-022-01175-z. Nat Genet. 2022. PMID: 36138230 No abstract available.

References

    1. Martincorena I et al. Somatic mutant clones colonize the human esophagus with age. Science 362, 911–917 (2018). - PMC - PubMed
    1. Yizhak K et al. RNA sequence analysis reveals macroscopic somatic clonal expansion across normal tissues. Science 364(2019). - PMC - PubMed
    1. Yokoyama A et al. Age-related remodelling of oesophageal epithelia by mutated cancer drivers. Nature 565, 312–317 (2019). - PubMed
    1. Yoshida K et al. Tobacco smoking and somatic mutations in human bronchial epithelium. Nature (2020). - PMC - PubMed
    1. Martincorena I et al. High burden and pervasive positive selection of somatic mutations in normal human skin. Science 348, 880–886 (2015). - PMC - PubMed

Publication types

MeSH terms

Substances