. 2022 Oct;54(10):1466-1469.
doi: 10.1038/s41588-022-01178-w. Epub 2022 Sep 22.

SAIGE-GENE+ improves the efficiency and accuracy of set-based rare variant association tests

Affiliations

SAIGE-GENE+ improves the efficiency and accuracy of set-based rare variant association tests

Wei Zhou et al. Nat Genet. 2022 Oct.

Erratum in

Abstract

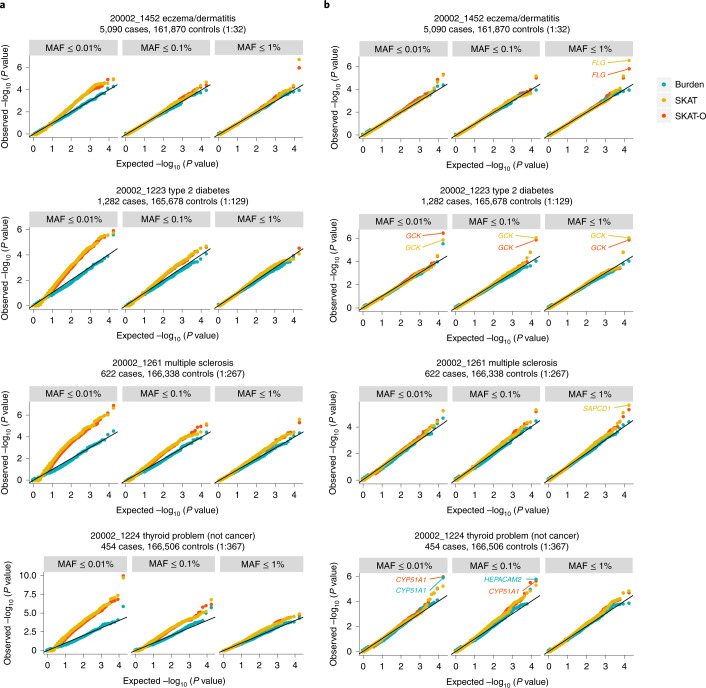
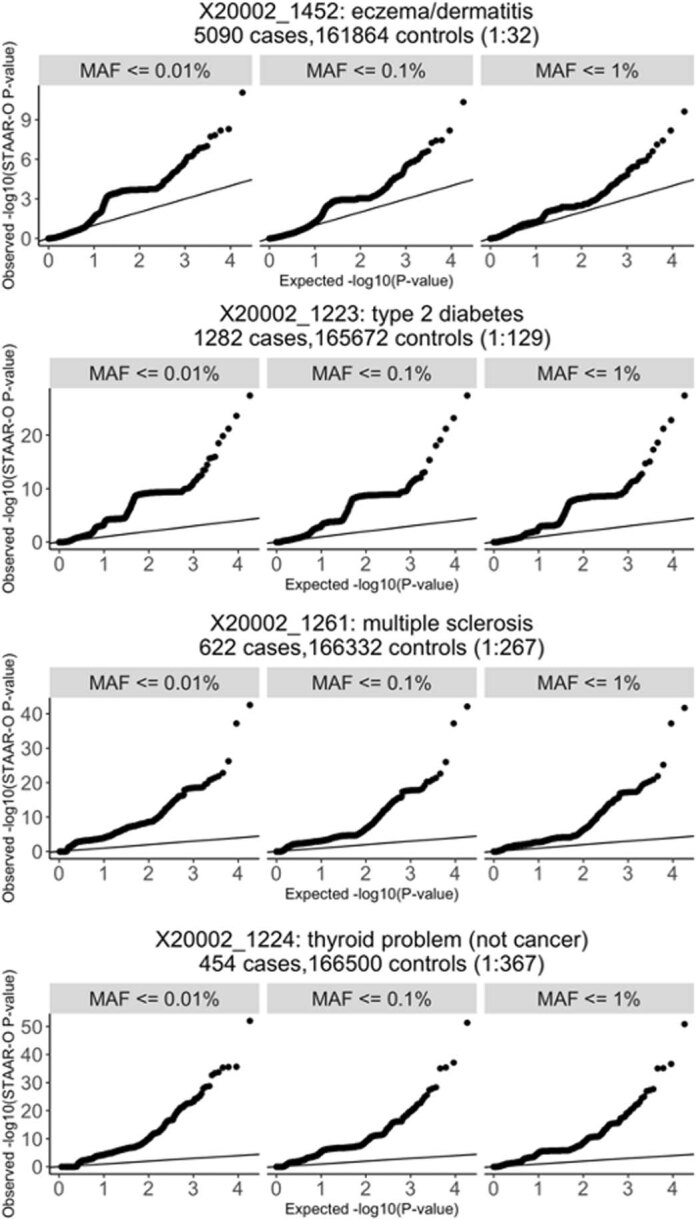
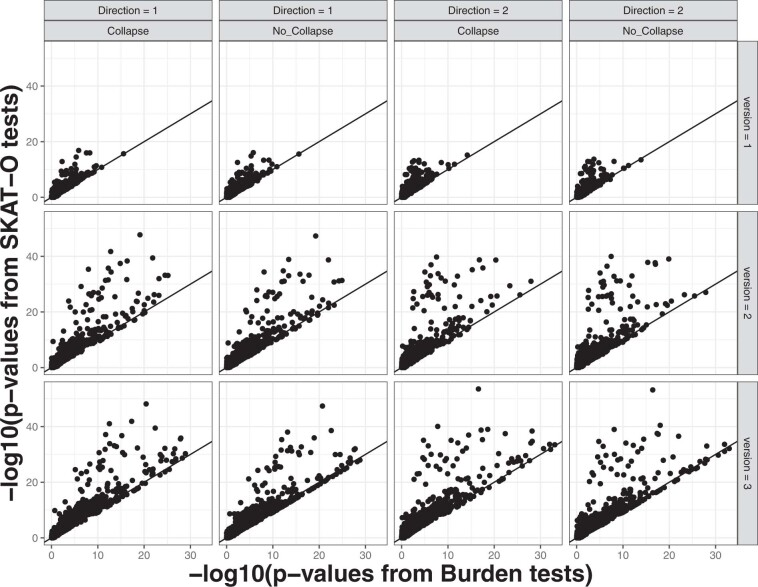
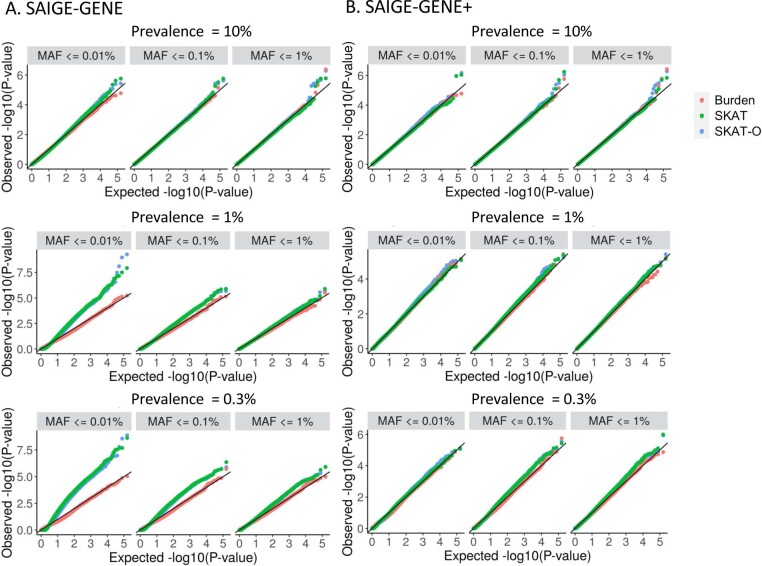
Several biobanks, including UK Biobank (UKBB), are generating large-scale sequencing data. An existing method, SAIGE-GENE, performs well when testing variants with minor allele frequency (MAF) ≤ 1%, but inflation is observed in variance component set-based tests when restricting to variants with MAF ≤ 0.1% or 0.01%. Here, we propose SAIGE-GENE+ with greatly improved type I error control and computational efficiency to facilitate rare variant tests in large-scale data. We further show that incorporating multiple MAF cutoffs and functional annotations can improve power and thus uncover new gene-phenotype associations. In the analysis of UKBB whole exome sequencing data for 30 quantitative and 141 binary traits, SAIGE-GENE+ identified 551 gene-phenotype associations.


Conflict of interest statement

B.M.N. is a member of Deep Genomics Scientific Advisory Board, has received travel expenses from Illumina, and also serves as a consultant for Avanir and Trigeminal solutions. K.J.K. is a consultant for Vor Biopharma. The remaining authors declare no competing interests.

Figures

Fig. 1
Fig. 1. Q–Q plots for Burden, SKAT and SKAT-O for four exemplary binary phenotypes in UKBB WES data using SAIGE-GENE and SAIGE-GENE+.
a, SAIGE-GENE. b, SAIGE-GENE+. Burden, SKAT and SKAT-O tests were performed for 18,372 genes with missense and LoF variants with three different maximum MAF cutoffs (1%, 0.1% and 0.01%). Names of genes reaching the exome-wide significance threshold (two-sided P < 2.5 × 10−6) in SAIGE-GENE+ are annotated in the plots.
Fig. 2
Fig. 2. Performance of SAIGE-GENE+ in UKBB WES data.
a, Computation time and memory of the gene-based tests (Step 2; Methods) in SAIGE-GENE and SAIGE-GENE+ for four genes with different numbers of variants. The SKAT-O tests were conducted with three maximum MAF cutoffs (1%, 0.1% and 0.01%) and three variant annotations (LoF only, LoF+missense and LoF+missense+synonymous) and combined using the Cauchy combination or minimum P value approach. Plots are in the log10 –log10 scale. Details of the numbers and genes are presented in Supplementary Table 1. b, Most significant variant sets across the three different MAF cutoffs (1%, 0.1% and 0.01%) and three functional annotations (LoF (L) only, LoF+missense (M+L) and LoF+missense+synonymous (S+M+L)). Distribution of variant sets with the smallest P values among 551 significant gene–phenotype associations identified by SAIGE-GENE+ in the analyses of 30 quantitative traits and 141 binary traits in the UKBB WES data.
Extended Data Fig. 1
Extended Data Fig. 1. Quantile-quantile plots for STAAR-O tests P values for four exemplary binary phenotypes with different case–control ratios in the UKBB WES data.
The STAAR-O tests were performed for 18,372 genes with missense and loss-of-function (LoF) variants with three different maximum MAF cutoffs (1%, 0.1%, and 0.01%).
Extended Data Fig. 2
Extended Data Fig. 2. Scatter plots for association P values of SKAT-O and Burden tests in the simulation studies.
Each plot is based on test results for 1,000 test sets (100 data sets, each of which includes 10 genes; see Supplementary Table 6). The x-axis represents -log10 Burden test P values, and y-axis represents -log10 SKAT-O P values. The line in each plot represents the 45-degree line, so dots above the line have more significant P values from SKAT-O than the Burden test. The details of different simulation settings are presented in Supplementary Table 7. Tests conducted in the analysis were two-sided.
Extended Data Fig. 3
Extended Data Fig. 3. Genomic control inflation lambda values for 24 binary phenotypes in UKBB for SAIGE-GENE and SAIGE-GENE+.
Genomic control inflation lambda values based on the 1st percentile against the disease prevalence for 24 binary phenotypes in UKBB for SAIGE-GENE and SAIGE-GENE+ using three different maximum MAF cutoffs.
Extended Data Fig. 4
Extended Data Fig. 4. Quantile-quantile plots for Burden, SKAT, and SKAT-O tests P values for simulated phenotypes with prevalence 10%, 1%, and 0.3% based on the UKBB WES data under the null hypothesis.
a, Using SAIGE-GENE. b, Using SAIGE-GENE+, which collapses ultra-rare variants with MAC ≤ 10 prior to the gene-based association tests. The tests were performed for 18,372 genes with missense and loss-of-function variants with three different maximum MAF cutoffs (1%, 0.1%, and 0.01%). Tests conducted in the analysis were two-sided.
Extended Data Fig. 5
Extended Data Fig. 5. Collapsing ultra-rare variants with MAC ≤ 10.
Demonstration on collapsing ultra-rare variants.
Extended Data Fig. 6
Extended Data Fig. 6. Histogram of number of genetic variants (missense and LoF) tested in each gene with maximum MAF 1% before and after collapsing the ultra-rare variants with MAC ≤ 10.
a, All genes. b, Genes with number of markers ≤ 500 before collapsing.
Extended Data Fig. 7
Extended Data Fig. 7. Computational cost of Step 2 in SAIGE-GENE+ with and without collapsing ultra-rare variants by sample sizes for gene-based tests for 18,372 genes with three maximum MAF cutoffs (1%, 0.1%, and 0.01%) and three variant annotations (LoF only, LoF + missense, and LoF + missense + synonymous).
In total, around 165,348 tests were run for each data set. Benchmarking was performed on randomly sub-sampled UK Biobank WES data with White British participants for glaucoma (1,741 cases and 162,408 controls). The reported run times and memory are medians of five runs with samples randomly selected from the full sample set using different sampling seeds. a, Plots of the time usage as a function of sample size (N). b, Plots of the maximum memory usage (for genes containing most variants) as a function of sample size (N). The x-axis is plotted on the log2 scale. c, Scatter plots of the memory usage when N = 150,000 simulated with a random seed. We split the 165,348 tests into 133 chunks, each with ~150 genes. For each gene, nine SKAT-O tests were conducted corresponding to three different MAF cutoffs and functional annotations followed by combining the P values using the Cauchy combination or minimum P-value approach. Tests conducted in the analysis were two-sided. Each dot in the plot is the maximum memory usage of a chunk among five runs with different random seeds.
Extended Data Fig. 8
Extended Data Fig. 8. Computation cost in SAIGE-GENE+ and REGENIE2 by sample sizes for gene-based tests for 18,372 genes with three maximum MAF cutoffs (1%, 0.1%, and 0.01%) and three variant annotations (LoF only, LoF + missense, and LoF + missense + synonymous).
In total, 165,348 tests were run for each data set. Benchmarking was performed on randomly sub-sampled UK Biobank WES data with White British participants for glaucoma (1,741 cases and 162,408 controls). The reported run times and memory are medians of five runs with samples randomly selected from the full sample set using different sampling seeds. a, Pplots of the time usage and median memory usage in Step 1 as a function of sample size (N). b, Plots of the time usage and median memory usage in Step 2 as a function of sample size (N). Note that singletons only were also included as a mask in the Burden tests in both methods for a fair comparison. SAIGE-GENE+ further automatically output the P values by the Cauchy combination or minimum P-value approach. Tests conducted in the analysis were two-sided.
Extended Data Fig. 9
Extended Data Fig. 9. Histograms of kinship coefficients (≥ 0.05) in UKBB.
a, All 408,910 samples. b, 200,643 samples with whole exome sequencing data available.

References

    1. Bycroft C, et al. The UK Biobank resource with deep phenotyping and genomic data. Nature. 2018;562:203–209. doi: 10.1038/s41586-018-0579-z. - DOI - PMC - PubMed
    1. Li X, et al. Dynamic incorporation of multiple in silico functional annotations empowers rare variant association analysis of large whole-genome sequencing studies at scale. Nat. Genet. 2020;52:969–983. doi: 10.1038/s41588-020-0676-4. - DOI - PMC - PubMed
    1. Liu Y, Xie J. Cauchy combination test: a powerful test with analytic p-value calculation under arbitrary dependency structures. J. Am. Stat. Assoc. 2020;115:393–402. doi: 10.1080/01621459.2018.1554485. - DOI - PMC - PubMed
    1. Zhou W, et al. Scalable generalized linear mixed model for region-based association tests in large biobanks and cohorts. Nat. Genet. 2020;52:634–639. doi: 10.1038/s41588-020-0621-6. - DOI - PMC - PubMed
    1. Wu MC, et al. Rare-variant association testing for sequencing data with the sequence kernel association test. Am. J. Hum. Genet. 2011;89:82–93. doi: 10.1016/j.ajhg.2011.05.029. - DOI - PMC - PubMed

Publication types