. 2022 Sep 23;28(1):117.
doi: 10.1186/s10020-022-00545-x.

PACS-2 deficiency in tubular cells aggravates lipid-related kidney injury in diabetic kidney disease

Affiliations

PACS-2 deficiency in tubular cells aggravates lipid-related kidney injury in diabetic kidney disease

Chanyue Zhao et al. Mol Med. .

Abstract

Background: Lipid accumulation in tubular cells plays a key role in diabetic kidney disease (DKD). Targeting lipid metabolism disorders has clinical value in delaying the progression of DKD, but the precise mechanism by which molecules mediate lipid-related kidney injury remains unclear. Phosphofurin acidic cluster sorting protein 2 (PACS-2) is a multifunctional sorting protein that plays a role in lipid metabolism. This study determined the role of PACS-2 in lipid-related kidney injury in DKD.

Methods: Diabetes was induced by a high-fat diet combined with intraperitoneal injections of streptozotocin (HFD/STZ) in proximal tubule-specific knockout of Pacs-2 mice (PT-Pacs-2-/- mice) and the control mice (Pacs-2fl/fl mice). Transcriptomic analysis was performed between Pacs-2fl/fl mice and PT-Pacs-2-/- mice.

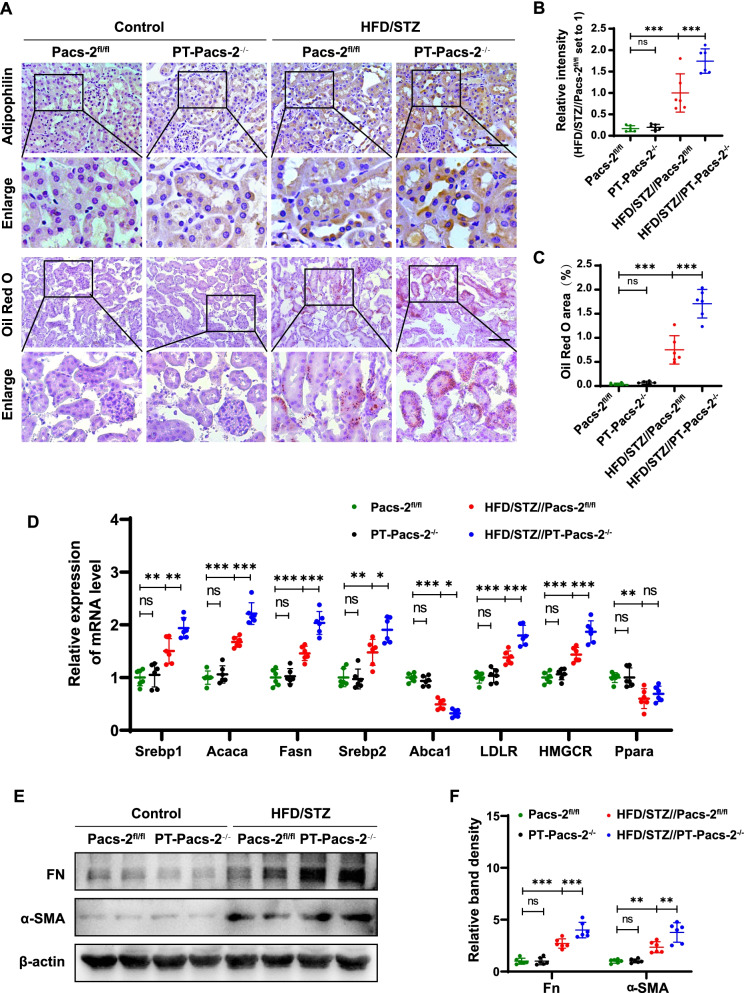
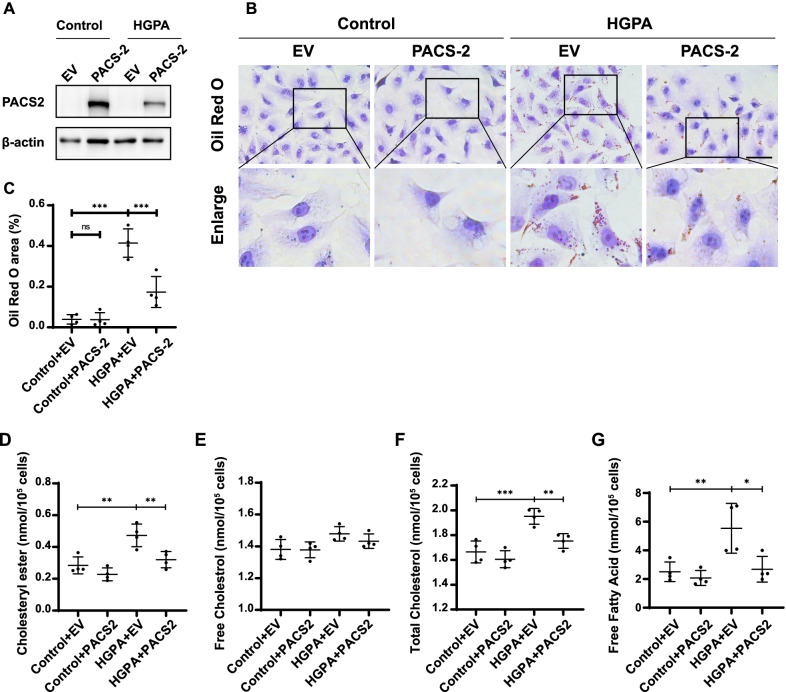
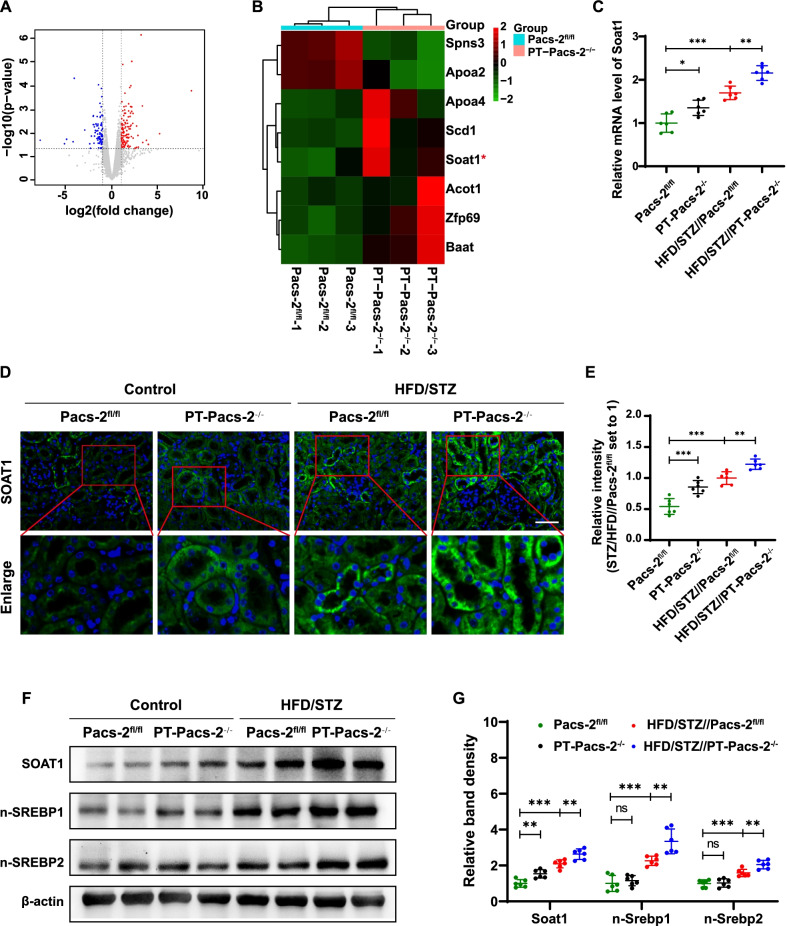
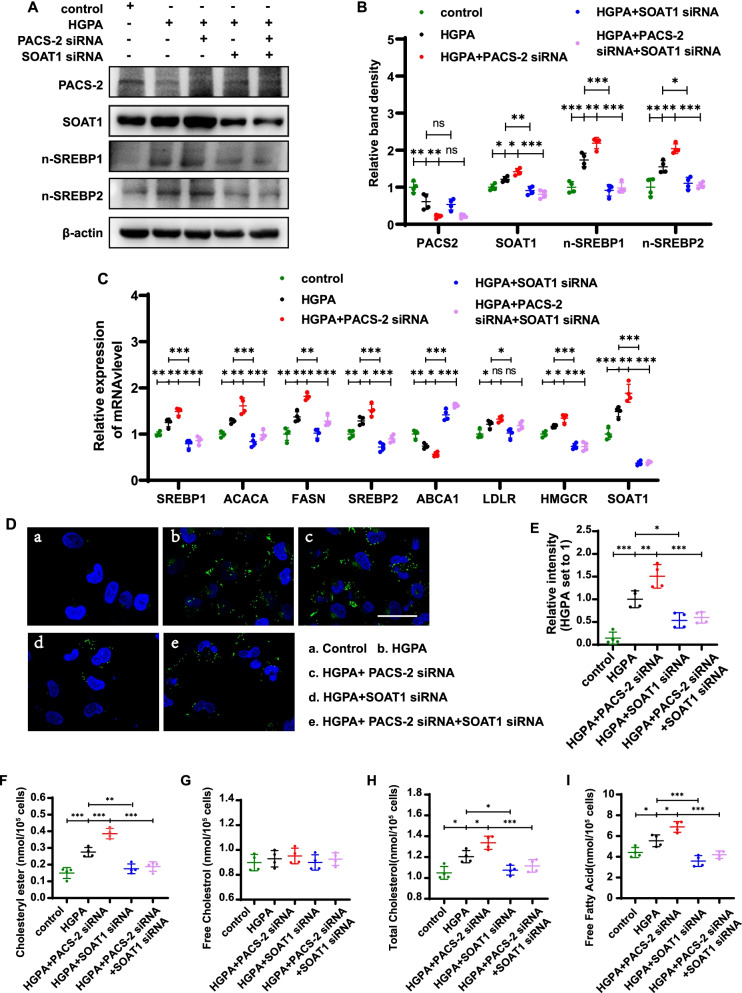
Results: Diabetic PT-Pacs-2-/- mice developed more severe tubule injury and proteinuria compared to diabetic Pacs-2fl/fl mice, which accompanied with increasing lipid synthesis, uptake and decreasing cholesterol efflux as well as lipid accumulation in tubules of the kidney. Furthermore, transcriptome analysis showed that the mRNA level of sterol O-acyltransferase 1 (Soat1) was up-regulated in the kidney of control PT-Pacs-2-/- mice. Transfection of HK2 cells with PACS-2 siRNA under high glucose plus palmitic acid (HGPA) condition aggravated lipid deposition and increased the expression of SOAT1 and sterol regulatory element-binding proteins (SREBPs), while the effect was blocked partially in that of co-transfection of SOAT1 siRNA.

Conclusions: PACS-2 has a protective role against lipid-related kidney injury in DKD through SOAT1/SREBPs signaling.

Keywords: Diabetic kidney disease; PACS-2; SOAT1; SREBP.


Conflict of interest statement

The authors declare that they have no competing interests.

Figures

Fig. 1
Fig. 1
Tubule-specific Pacs-2 deletion aggravates kidney injury in HFD/STZ treated mice. A and B Western blot and quantification of PACS-2 expression showing that PACS-2 was knocked out in renal cortex. C Body weight and D blood glucose are shown. E Kidney weight/body weight (KW/BW) ratio, F Urine albumin-to-creatinine ratio (UACR) and urinary NAG in mice are shown. G Morphological examinations of tubular and glomerular changes by HE, PAS, Masson staining. Scale bars: 50 μm. H and I Quantification of tubular damage score and glomerular damage score of the kidneys in each group. All data are presented as means ± SD; *p < 0.05, **p < 0.01, ***p < 0.001, ns, not significant. n = 6
Fig. 2
Fig. 2
Pacs-2 gene deficiency contributes to lipid accumulation in tubular cells of diabetic mice. A Representative images showing lipid deposition by immunohistochemistry of Adipophilin and Oil Red O staining of kidney from mice. Scale bars: 50 μm. B and C Relative Adipophilin expression and Oil Red O staining area. D Measurement of the mRNA expression of selected markers. E and F Western blot and quantification of FN and α-SMA. All data are presented as means ± SD; *p < 0.05, **p < 0.01, ***p < 0.001. n = 6
Fig. 3
Fig. 3
Overexpression of PACS-2 ameliorates lipid accumulation in HK-2 cells induced by HGPA. A Gene overexpression efficiency of PACS-2 by western blot analysis in PACS-2 plasmid transfected HK-2 cells. B Representative Oil Red O staining images of HK-2 cells in different groups. Scale bar: 20 μm. C Oil Red O staining area. D Cholesteryl ester content. E Free cholesterol content. F Total cholesterol content. G Free fatty acid content. All data are presented as means ± SD; *p < 0.05, **p < 0.01, ***p < 0.001. n = 4
Fig. 4
Fig. 4
Identification of Soat1 as a downstream molecule of Pacs-2. A Volcano plot of DEGs in kidney cortex of control Pacs-2fl/fl mice and control PT-Pacs-2−/− mice. Splashes represent different genes, and the gray splashes mean genes without significant different expression. The red splashes mean significantly up-regulated genes in control PT-Pacs-2−/− mice, and the blue splashes mean significantly down-regulated genes in control PT-Pacs-2−/− mice. B Heat map of top eight DEGs involved in lipid metabolism; n = 3 mice per group. C Real-time qRT-PCR showing the relative mRNA expression of Soat1. n = 6 mice per group. D Representative immunofluorescence images of SOAT1 (green) in kidney tissues from each group. The nuclei were delineated by DAPI (blue). n = 6 mice per group. Bars = 50 μm. E Semiquantification analysis of protein expression. F Representative western blot bands of SOAT1, n-SREBP1, n-SREBP2 expression in the kidney cortex, n = 6 mice per group. G Relative band density. All data are presented as means ± SD; *p < 0.05, **p < 0.01, ***p < 0.001
Fig. 5
Fig. 5
Treatment of HK-2 cells with PACS-2 and SOAT1 siRNA regulates lipid metabolism. A and B Representative western blot and quantification of PACS-2, SOAT1, n-SREBP1, n-SREBP2 in HK-2 cells. C Measurement of the mRNA expression of selected markers. D Representative images of cells stained with Bodipy (green); nuclei stained with Hoechst (blue). E Quantification of the Bodipy staining. F Cholesteryl ester content. G Free cholesterol content. H Total cholesterol content. I Free fatty acid content. All data are presented as means ± SD; *p < 0.05, **p < 0.01, ***p < 0.001. n = 4

References

    1. Arruda AP, Pers BM, Parlakgul G, Guney E, Inouye K, Hotamisligil GS. Chronic enrichment of hepatic endoplasmic reticulum-mitochondria contact leads to mitochondrial dysfunction in obesity. Nat Med. 2014;20:1427–1435. doi: 10.1038/nm.3735. - DOI - PMC - PubMed
    1. Bohle A, Mackensen-Haen S, Von Gise H. Significance of tubulointerstitial changes in the renal cortex for the excretory function and concentration ability of the kidney: a morphometric contribution. Am J Nephrol. 1987;7:421–433. doi: 10.1159/000167514. - DOI - PubMed
    1. Chang TY, Chang CC, Ohgami N, Yamauchi Y. Cholesterol sensing, trafficking, and esterification. Annu Rev Cell Dev Biol. 2006;22:129–157. doi: 10.1146/annurev.cellbio.22.010305.104656. - DOI - PubMed
    1. Chang TY, Li BL, Chang CC, Urano Y. Acyl-coenzyme A: cholesterol acyltransferases. Am J Physiol Endocrinol Metab. 2009;297:E1–9. doi: 10.1152/ajpendo.90926.2008. - DOI - PMC - PubMed
    1. Chen X, Han Y, Gao P, Yang M, Xiao L, Xiong X, et al. Disulfide-bond A oxidoreductase-like protein protects against ectopic fat deposition and lipid-related kidney damage in diabetic nephropathy. Kidney Int. 2019;95:880–895. doi: 10.1016/j.kint.2018.10.038. - DOI - PubMed

Publication types