. 2022 Aug 31;11(9):1298.
doi: 10.3390/biology11091298.

A High-Throughput Search for SFXN1 Physical Partners Led to the Identification of ATAD3, HSD10 and TIM50

Affiliations

A High-Throughput Search for SFXN1 Physical Partners Led to the Identification of ATAD3, HSD10 and TIM50

Nesrine Tifoun et al. Biology (Basel). .

Abstract

Sideroflexins (SFXN, SLC56) are a family of evolutionarily conserved mitochondrial carriers potentially involved in iron homeostasis. One member of the SFXN family is SFXN1, recently identified as a human mitochondrial serine transporter. However, little is known about the SFXN1 interactome, necessitating a high-throughput search to better characterize SFXN1 mitochondrial functions. Via co-immunoprecipitation followed by shotgun mass spectrometry (coIP-MS), we identified 96 putative SFXN1 interactors in the MCF7 human cell line. Our in silico analysis of the SFXN1 interactome highlights biological processes linked to mitochondrial organization, electron transport chains and transmembrane transport. Among the potential physical partners, ATAD3A and 17β-HSD10, two proteins associated with neurological disorders, were confirmed using different human cell lines. Nevertheless, further work will be needed to investigate the significance of these interactions.

Keywords: 17β-HSD10; ATAD3A; SFXN1; TIM50; mitochondria; sideroflexin.


Conflict of interest statement

The authors declare no conflict of interest.

Figures

Figure 1
Figure 1
SFXN1 is a mitochondrially localized protein that is highly abundant in human cell lines. (ac) Western blot analysis of SFXN1 levels in commonly used human cell lines or rat tissues. Total proteins were revealed using stain-free imaging of the membrane before immunodetection of SFXN1 with a commercial rabbit antibody (Sigma-Aldrich Cat# HPA019543, RRID:AB_1856789). Tubulin, Tom20 and the β subunit of the F1F0-ATPase (ATP5b)) served as a loading control. (d,e) Cell fractionation was performed on extracts from wild-type Drosophila larvae (d) and MCF7 cells (E). Total extracts (T.E.), cytosolic (Cyto) and mitochondrial (Mito) fractions were subjected to immunoblot analysis using the same anti-SFXN1 antibody as in panel a. ATP5b and Tom20 served as mitochondrial controls. (f) Sum projection of three consecutive stacks of MCF7 cell with SFXN1 (green) and cytochrome c (red) mitochondrial labeling on the left. One cell is shown; Figure S2c for the whole field. Signal distribution profile of green and red pixels, corresponding to the white horizontal bar on the left image, is shown on the right (upper panel), with highly similar behaviors. Correlations of green versus red intensities (black dots) corresponding to three individual projected stacks are also presented (on the right, lower panel). Pearson correlation coefficient (r) and best fitting line (red line) are shown; correlation is highly significant (p < 0.0001 two-tail test). Manders’s overlap coefficient (MOC) is also expressed. Both values, r and MOC, being high indicate a strong and significant colocalization between SFXN and Cyt c staining.
Figure 2
Figure 2
High-throughput search for SFXN1 physical partners (CoIP-MS) and related biological pathways. (a) Scheme of the methodology chosen to identify SFXN1 binding partners. An anti-SFXN1 antibody (Atlas Antibodies Cat# HPA063745, RRID:AB_2685111) was used to co-immunoprecipitate SFXN1 and its binding partners from MCF7-derived mitochondrial fractions. A control IP was performed using a non-specific rabbit IgG. Proteins identified by MS/MS solely in the SFXN1 immunoprecipitation and not in the control were listed as potential SFXN1 binding partners. (b) Venn diagram showing the overlaps between the potential SFXN1 partners and the mitochondrial proteins identified with MS/MS. Mitochondrial proteins were identified based on the Gene Ontology Annotation tool. (c) Biological processes related to the potential partners of SFXN1 determined using PANTHER Overrepresentation test.
Figure 3
Figure 3
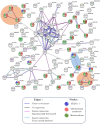
Analysis of the SFXN1 interactome using STRING. STRING protein–protein interaction network (https://string-db.org (accessed on 1 November 2019)) was constructed for physical partners found in our co-IP-MS/MS experiment. Two strong clusters are found between proteins of the electron transfer chain (complexes I and IV, in the orange areas) and one cluster involving TIM50 and SFXN1 is highlighted (in the blue area). SFXN family members, mitochondrial proteins and mitochondrial membrane proteins are colored in blue, green and red, respectively.
Figure 4
Figure 4
Metascape Enrichment analysis for SFXN1 partners. (a) Metascape bar graph for viewing top non-redundant enrichment clusters, one per cluster, using a discrete color scale to represent statistical significance (dark orange for the most significant clusters). (b) Hits from the top 3 enrichment clusters (mitochondrial transmembrane transport, mitochondrion organization, TCA cycle and respiratory chain).
Figure 5
Figure 5
Comparison of top 20 enriched terms related to mitochondrial proteins and SFXN1 partners. Heatmap of enriched terms across input gene lists, colored by p-values (grey cells indicate the lack of enrichment for that term in the corresponding gene list) [3].
Figure 6
Figure 6
(a) Metascape visualization of the network formed by SFXN1 partners identified in our IP-MS/MS experiment. Densely connected complexes identified by the MCODE algorithm are colored according to their identities. (b) Four MCODE protein complexes extracted from the SFXN1 network. Functional annotations based on the top three functional enriched terms were available for MCODE1, MCODE 2 and MCODE4 complexes.
Figure 7
Figure 7
Circos plot showing overlapping genes from this study and Liu et al. [33]. On the outside, each arc represents a gene list. On the inside, dark orange represents the genes that are shared by the two lists, and light orange represents genes that are unique to a gene list. Purple lines link the same gene shared by the two lists. Blue lines link different genes that fall under the same ontology term. The table gives the list of shared genes.
Figure 8
Figure 8
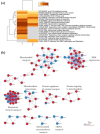
Visualization of the meta-analysis results based on the two lists of SFXN1 binding partners. (a) Heatmap showing the top enrichment clusters colored according to their significance. The term with the best p-value within each cluster is given as its representative term. (b) Metascape visualization illustrating densely-connected protein–protein interaction networks automatically identified from the merged lists of SFXN1 physical partners. A representative GO term was chosen between the top three best p-value terms to depict each MCODE network, when available. Network nodes are displayed as pies. Color code for pie sector represents a gene list (blue for our list, red for Liu et al.’s list).
Figure 9
Figure 9
ATAD3, 17β-HSD10 and TIM50 are physical partners of SFXN1. (a) CoIP of ATAD3A, 17β-HSD10 and TIM50 using an anti-SFXN1 antibody on mitochondrial enriched fractions of MCF7, COV434, HCT116 and SH-SY5Y cells. An isotypic control (rabbit IgG) was used to ensure the specificity of the SFXN1 coIP. No coIP of the β subunit of the F1F0 ATPase (ATP5B) was seen and thus serves as a negative control. (b) Proximity ligation assay showing the physical vicinity of SFXN1 and 17β-HSD10 in MCF7 cells (red dots). Signal quantification regarding the control condition (without primary antibodies) is reported on the right panel. Two independent experiments gave similar results. Scale bar: 10 μm.

References

    1. Armstrong J.F., Faccenda E., Harding S.D., Pawson A.J., Southan C., Sharman J.L., Campo B., Cavanagh D.R., Alexander S.P., Davenport A.P., et al. The IUPHAR/BPS guide to pharmacology in 2022: Curating pharmacology for COVID-19, malaria and antibacterials. Nucl. Acids Res. 2022;50:D1282–D1294. doi: 10.1093/nar/gkab1010. - DOI - PMC - PubMed
    1. Gyimesi G., Hediger M.A. Sequence Features of Mitochondrial Transporter Protein Families. Biomolecules. 2020;10:1611. doi: 10.3390/biom10121611. - DOI - PMC - PubMed
    1. Tifoun N., De las Heras J.M., Guillaume A., Bouleau S., Mignotte B., Le Floch N. Insights into the Roles of the Sideroflexins/SLC56 Family in Iron Homeostasis and Iron-Sulfur Biogenesis. Biomedicines. 2021;9:103. doi: 10.3390/biomedicines9020103. - DOI - PMC - PubMed
    1. Hildick-Smith G.J., Cooney J.D., Garone C., Kremer L.S., Haack T.B., Thon J.N., Miyata N., Lieber D.S., Calvo S.E., Akman H.O., et al. Macrocytic Anemia and Mitochondriopathy Resulting from a Defect in Sideroflexin 4. Am. J. Hum. Genet. 2013;93:906–914. doi: 10.1016/j.ajhg.2013.09.011. - DOI - PMC - PubMed
    1. Tulinius M., Kollberg G., Darin N., Oldfors A., Asin-Cayuela J. Congenital Mitochondrial Encephalomyopathy with Complex I Deficiency Due to Mutations in Sideroflexin 4 (SFXN4) Neuromuscul. Disord. 2016;26:S175. doi: 10.1016/j.nmd.2016.06.324. - DOI