. 2022 Sep 5;12(9):1195.
doi: 10.3390/brainsci12091195.

EEG-Parameter-Guided Anesthesia for Prevention of Emergence Delirium in Children

Affiliations

EEG-Parameter-Guided Anesthesia for Prevention of Emergence Delirium in Children

Yaqian Han et al. Brain Sci. .

Abstract

Background: Emergence delirium (ED) usually occurs in children after surgery with an incidence of 10−80%. Though ED is mostly self-limited, its potential injuries cannot be ignored. Whether electroencephalography (EEG)-parameter-guided anesthesia could reduce the incidence of ED in pediatric surgery has not been fully discussed to date. Methods: Fifty-four boys aged 2−12 years undergoing elective hypospadias surgery under sevoflurane anesthesia were selected. In the EEG-parameter-guided group (E group), sevoflurane was used for anesthesia induction and was maintained by titrating the spectral edge frequency (SEF) to 10−15 and combining the monitoring of density spectral array (DSA) power spectra and raw EEG. While in the control group (C group), anesthesiologists were blinded to the SedLine screen (including SEF, DSA, and raw EEG) and adjusted the intraoperative drug usage according to their experience. Patients with a Pediatric Anesthesia Emergence Delirium (PAED) score > 10 were diagnosed with ED, while patients with a PAED score > 2 were diagnosed with emergence agitation (EA). Results: Finally, a total of 37 patients were included in this trial. The incidence of ED in the E group was lower than in the C group (5.6% vs. 36.8%; p = 0.04), while the incidence of EA was similar in the two groups (61% vs. 78.9%; p = 0.48). Intraoperative parameters including remifentanil dosage and the decrease in mean arterial pressure (MAP) were not different between the two groups (p > 0.05), but the mean end-tidal sevoflurane concentration (EtSevo) was lower in the E group than in the C group (p > 0.05). Moreover, during PACU stay, the extubation time and discharge time of the groups were similar, while the PAED scores within 5 min from extubation and the Face, Legs, Activity, Cry, and Consolability (FLACC) scores within 30 min from extubation were lower in the E group than in the C group. Conclusion: EEG-parameter-guided anesthesia management reduced the incidence of ED in children. Studies with larger sample sizes are needed to obtain more convincing results.

Keywords: DSA; EEG; SEF; anesthetic depth; emergence delirium; pediatric anesthesia.


Conflict of interest statement

The authors declare no conflict of interest.

Figures

Figure 1
Figure 1
CONSORT flowchart of recruitment and inclusion of subjects.
Figure 2
Figure 2
Interpretation of SedLine Monitor indices. (A) The four channels of EEG from top to bottom are, respectively, L1 (FP1), R1 (FP2), L2 (F7), and R2 (F8) synchronous electrical activities. (B) PSI, specific quantitative index of anesthesia depth. (C) Electromyography (EMG), which represents the measurement index of temporal muscle relaxation. SR, burst suppression; the presence of burst suppression indicates too-deep anesthesia. ARTF, percentage of false difference (interference). SEFL, SEFR; the distribution represents the spectral edge frequency of the left and right sides of the brain, which is the frequency range where 95% of the brain electrical activity is located. (D) DSA (density spectral array), which reflects the relationship between EEG power and frequency over time. The white line represents the spectral marginal rate including the SEF; the upper and lower parts are the spectral arrays of the left and right sides of the brain; and the color band on the right represents the power intensity. The higher the power, the brighter the spectral array in the frequency range where it is located.
Figure 3
Figure 3
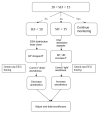
Intervention flow diagram. SEF, spectral edge frequency; BP, blood pressure; HR, heart rate; EEG, electroencephalography.
Figure 4
Figure 4
PAED scores at different time points. PAED, Pediatric Anesthesia Emergence Delirium; * p < 0.05.
Figure 5
Figure 5
FLACC scores at different time points. FLACC, Faces, Legs, Activity, Cry, and Consolability.
Figure 6
Figure 6
Duration of SEF < 10 or SEF > 15. SEF, spectral edge frequency; SEFL, SEF of left brain; SEFR, SEF of right brain; SEFL + SEFR, figure simultaneously representing SEFL and SEFR < 10 or >15; * p < 0.05.

References

    1. Eckenhoff J.E., Kneale D.H., Dripps R.D. The incidence and etiology of postanesthetic excitment. A clinical survey. Anesthesiology. 1961;22:667–673. doi: 10.1097/00000542-196109000-00002. - DOI - PubMed
    1. Moore A.D., Anghelescu D.L. Emergence Delirium in Pediatric Anesthesia. Paediatr. Drugs. 2017;19:11–20. doi: 10.1007/s40272-016-0201-5. - DOI - PubMed
    1. Safavynia S.A., Arora S., Pryor K.O., García P.S. An update on postoperative delirium: Clinical features, neuropathogenesis, and perioperative management. Curr. Anesthesiol. Rep. 2018;8:252–262. doi: 10.1007/s40140-018-0282-5. - DOI - PMC - PubMed
    1. Mohkamkar M.B., Farhoudi F.M., Alam-Sahebpour A.M., Mousavi S.A.M., Khani S.P., Shahmohammadi S.B. Postanesthetic Emergence Agitation in Pediatric Patients under General Anesthesia. Iran J. Pediatr. 2014;24:184–190. - PMC - PubMed
    1. Zhang C., Li J., Zhao D., Wang Y. Prophylactic midazolam and clonidine for emergence from agitation in children after emergence from sevoflurane anesthesia: A meta-analysis. Clin. Ther. 2013;35:1622–1631. doi: 10.1016/j.clinthera.2013.08.016. - DOI - PubMed

LinkOut - more resources