. 2022 Sep 2;12(9):1223.
doi: 10.3390/biom12091223.

Transcriptome Analyses Identify Deregulated MYC in Early Onset Colorectal Cancer

Affiliations

Transcriptome Analyses Identify Deregulated MYC in Early Onset Colorectal Cancer

Olivia M Marx et al. Biomolecules. .

Abstract

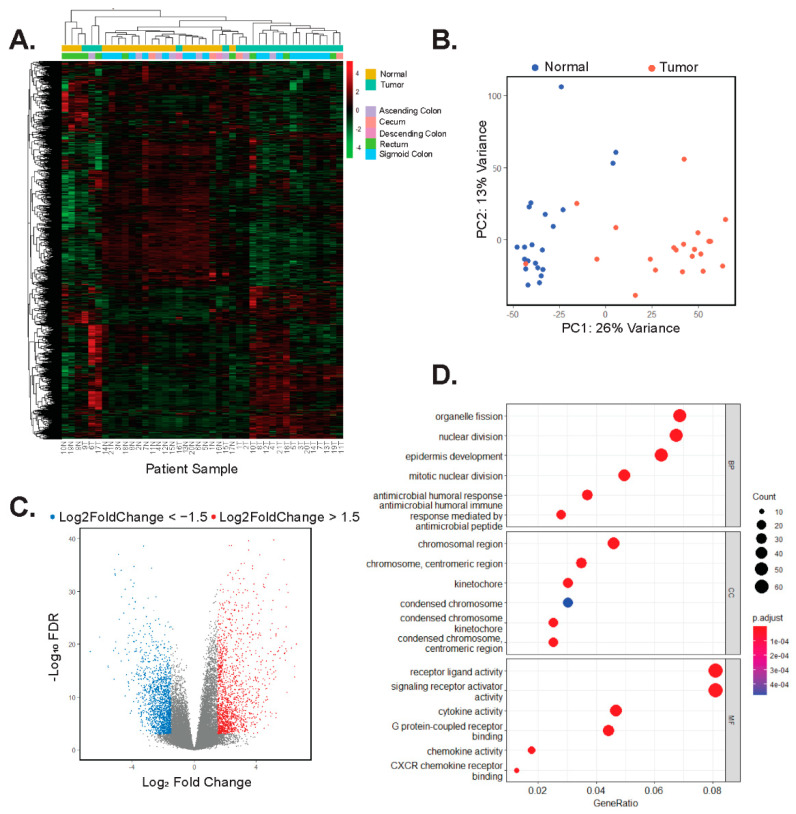
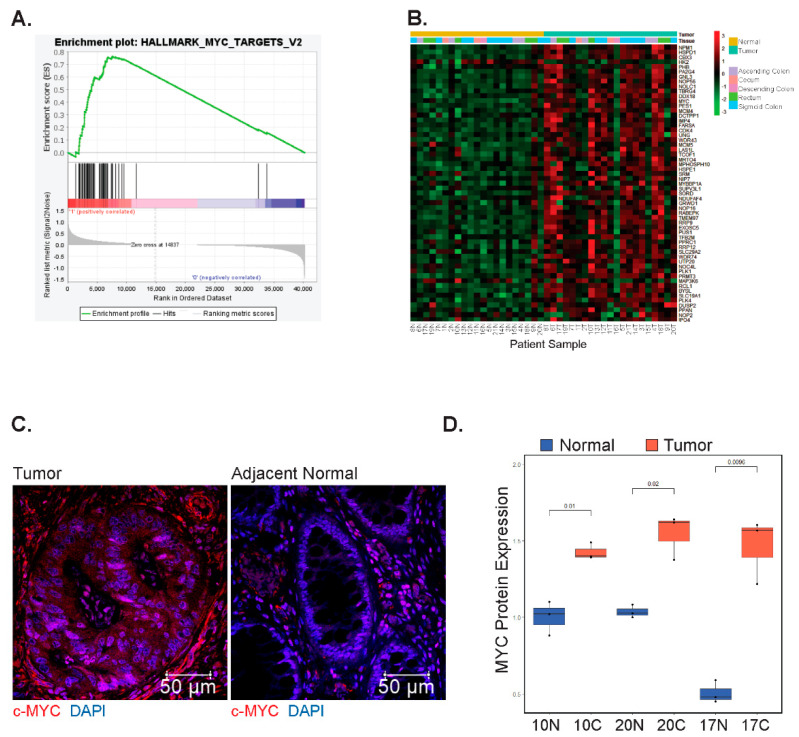
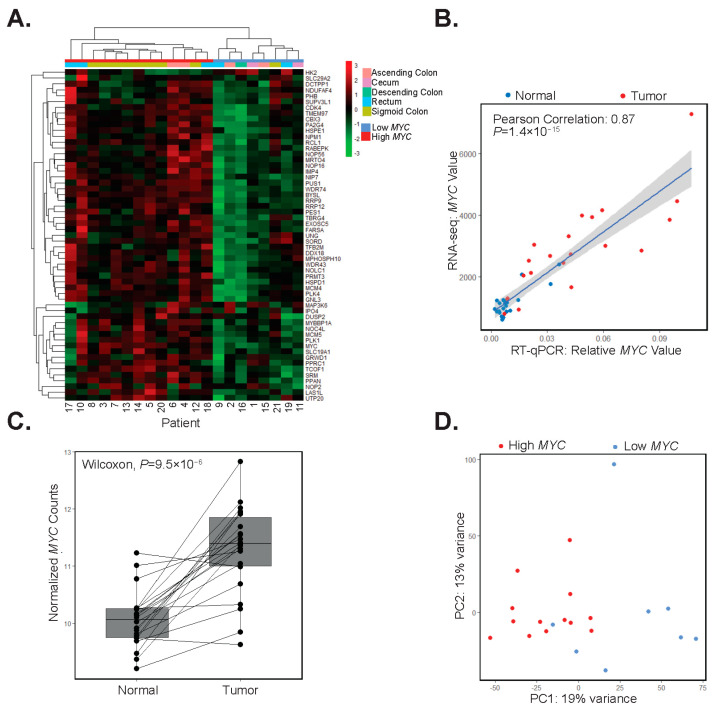
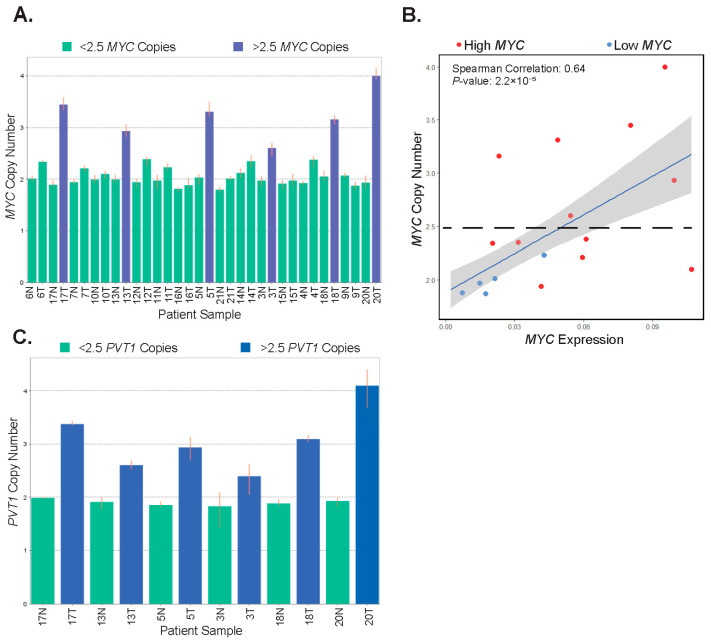
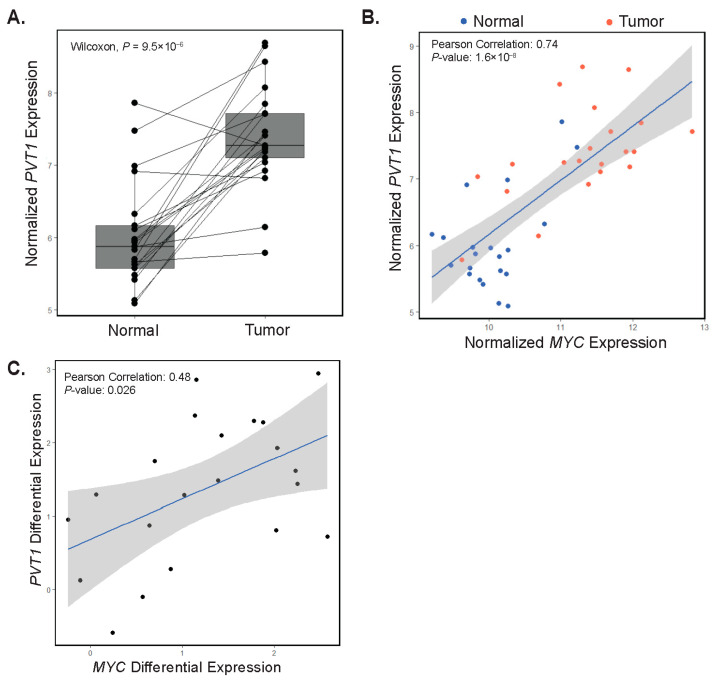
Despite a global decrease in colorectal cancer (CRC) incidence, the prevalence of early-onset colorectal cancer (EOCRC), or those occurring in individuals before the age of 50, has steadily increased over the past several decades. When compared to later onset colorectal cancer (LOCRC) in individuals over 50, our understanding of the genetic and molecular underpinnings of EOCRCs is limited. Here, we conducted transcriptomic analyses of patient-matched normal colonic segments and tumors to identify gene expression programs involved in carcinogenesis. Amongst differentially expressed genes, we found increased expression of the c-MYC proto-oncogene (MYC) and its downstream targets in tumor samples. We identified tumors with high and low differential MYC expression and found patients with high-MYC tumors were older and overweight or obese. We also detected elevated expression of the PVT1 long-non-coding RNA (lncRNA) in most tumors and found gains in copy number for both MYC and PVT1 gene loci in 35% of tumors evaluated. Our transcriptome analyses indicate that EOCRC can be sub-classified into groups based on differential MYC expression and suggest that deregulated MYC contributes to CRCs that develop in younger patients.

Keywords: MYC; PVT1; RNA-sequencing; early-onset colorectal cancer; transcriptome.


Conflict of interest statement

The authors declare no conflict of interest.

Figures

Figure 1
Figure 1
Tumors and adjacent colonic segments display distinct transcriptomic profiles. (A) Heatmap and hierarchical clustering of rlog normalized gene expression of the top 4000 most variable genes in tumors and adjacent control tissues. Patients are arbitrarily assigned 1–21 and N represents uninvolved tissues, whereas T represents tumor. (B) Principal component analysis (PCA) of the top 4000 most variable genes expressed in uninvolved (normal) and tumors. (C) Volcano plot of differentially expressed genes in tumors versus uninvolved control colonic tissues. Red points are 1521 genes whose expression is significantly upregulated (log2Foldchange > 1.5, p-adj < 0.05) and blue points are 1542 genes whose expression is significantly down-regulated (log2Foldchange < −1.5, p-adj < 0.05) in tumors versus controls. (D) GO analysis on the 1521 genes whose expression is upregulated in tumor samples. The top six results in each of the categories, biology processes (BP), cellular component (CC), and molecular function (MF) are shown in descending order.
Figure 2
Figure 2
MYC and its downstream targets are differentially expressed in EOCRC. (A) Gene set enrichment analysis (GSEA) of genes comprising the hallmark MYC target set in tumors compared with patient-matched uninvolved colonic segments (Nominal p-value = 0.011, Normalized Enrichment Score: 1.52). (B) Heatmap of row-scaled gene expression of MYC and its downstream targets in tumors and adjacent colonic segments. Patients are arbitrarily assigned 1–21 and N represents uninvolved tissues, whereas T represents tumors. (C) Representative IF images of tumors and matched normal samples stained using a primary antibody against MYC. (D) Quantification of MYC positive nuclei from 3 fields of view per sample (N = 3 matched samples).
Figure 3
Figure 3
Differential MYC target gene expression clusters patients into two groups. (A) Hierarchical clustering of differential expression of MYC and its target genes in patient-matched tumors and adjacent colonic segments scaled by row. (B) RT-qPCR analysis of MYC and correlation with its expression in RNA-seq datasets in adjacent colonic segments (normal, blue points) and tumors (red points) (Pearson correlation 0.89, p = 1.4 × 10⁻¹⁵). (C) Boxplot of rlog normalized expression of MYC with lines connecting adjacent colonic segments (Normal) and tumor samples (paired Wilcoxon test, p = 9.5 × 10⁻⁶). (D) Principal component analysis of the top 5000 most variable genes in tumor samples with red points indicating high-MYC and blue points indicating low-MYC tumors.
Figure 4
Figure 4
MYC and PVT1 copy number alterations are found in some patient tumors. (A) Bar graph depicting the copy number of the MYC gene locus in patient-matched uninvolved colonic segments (normal, N) and tumors (T). Highlighted in blue are tumor samples with 2.5 or greater copy number. (B) Correlation of MYC copy number and MYC expression in tumors. Red points are tumors expressing high-MYC and blue points are tumors expressing low-MYC (Pearson correlation estimate 0.68, p = 5.45 × 10⁻⁶). (C) Bar graph depicting the copy number of the PVT1 locus in the six patient-matched samples displaying gains in the MYC genomic locus in tumors (T). Uninvolved colonic tissues (normal, N) are shown as a reference. In (A,C), highlighted in blue are tumors samples with 2.5 or greater increases in copy number. Error bars represent the range of copy numbers detected in four technical replicates per sample.
Figure 5
Figure 5
Expression of PVT1 correlates with MYC expression. (A) rlog normalized expression plot of PVT1 in patient-matched adjacent colonic tissues (Normal) and tumors (paired Wilcoxon test, p = 4.8 × 10⁻⁶). Each point represents a single patient with a line drawn between matched samples. (B) Correlation plot depicting normalized MYC versus normalized PVT1 gene expression in adjacent colonic segments (Normal, blue points) and tumors (red points). (C) Correlation plot depicting PVT1 and MYC differential expression in patient-matched adjacent colonic segments and tumors.

References

    1. Siegel R.L., Miller K.D., Fuchs H.E., Jemal A. Cancer statistics, 2022. CA Cancer J. Clin. 2022;72:7–33. doi: 10.3322/caac.21708. - DOI - PubMed
    1. Hofseth L.J., Hebert J.R., Chanda A., Chen H., Love B.L., Pena M.M., Murphy E.A., Sajish M., Sheth A., Buckhaults P.J., et al. Early-onset colorectal cancer: Initial clues and current views. Nat. Rev. Gastroenterol. Hepatol. 2020;17:352–364. doi: 10.1038/s41575-019-0253-4. - DOI - PMC - PubMed
    1. Patel S.G., Ahnen D.J. Colorectal Cancer in the Young. Curr. Gastroenterol. Rep. 2018;20:15. doi: 10.1007/s11894-018-0618-9. - DOI - PubMed
    1. Cercek A., Chatila W.K., Yaeger R., Walch H., Fernandes G.D.S., Krishnan A., Palmaira L., Maio A., Kemel Y., Srinivasan P., et al. A Comprehensive Comparison of Early-Onset and Average-Onset Colorectal Cancers. JNCI J. Natl. Cancer Inst. 2021;113:1683–1692. doi: 10.1093/jnci/djab124. - DOI - PMC - PubMed
    1. Cavestro G.M., Mannucci A., Zuppardo R.A., Di Leo M., Stoffel E., Tonon G. Early onset sporadic colorectal cancer: Worrisome trends and oncogenic features. Dig. Liver Dis. 2018;50:521–532. doi: 10.1016/j.dld.2018.02.009. - DOI - PubMed

Publication types

MeSH terms

Substances