. 2022 Sep 13;12(9):1290.
doi: 10.3390/biom12091290.

Building Protein Atomic Models from Cryo-EM Density Maps and Residue Co-Evolution

Affiliations

Building Protein Atomic Models from Cryo-EM Density Maps and Residue Co-Evolution

Guillaume Bouvier et al. Biomolecules. .

Abstract

Electron cryo-microscopy (cryo-EM) has emerged as a powerful method by which to obtain three-dimensional (3D) structures of macromolecular complexes at atomic or near-atomic resolution. However, de novo building of atomic models from near-atomic resolution (3-5 Å) cryo-EM density maps is a challenging task, in particular because poorly resolved side-chain densities hamper sequence assignment by automatic procedures at a lower resolution. Furthermore, segmentation of EM density maps into individual subunits remains a difficult problem when the structure of the subunits is not known, or when significant conformational rearrangement occurs between the isolated and associated form of the subunits. To tackle these issues, we have developed a graph-based method to thread most of the C-α trace of the protein backbone into the EM density map. The EM density is described as a weighted graph such that the resulting minimum spanning tree encompasses the high-density regions of the map. A pruning algorithm cleans the tree and finds the most probable positions of the C-α atoms, by using side-chain density when available, as a collection of C-α trace fragments. By complementing experimental EM maps with contact predictions from sequence co-evolutionary information, we demonstrate that this approach can correctly segment EM maps into individual subunits and assign amino acid sequences to backbone traces to generate atomic models.

Keywords: co-evolution; cryo-EM; minimum spanning tree; model building; type 6 secretion system.


Conflict of interest statement

The authors declare no conflict of interest. The funders had no role in the design of the study; in the collection, analyses, or interpretation of data; in the writing of the manuscript, or in the decision to publish the results.

Figures

Figure 1
Figure 1
Fork pruning procedure. (a) Regularization of the nodes of the MSTree to be spaced by 3.8 Å. The anchoring Cα defining the reference position to regularize the positions are defined by nodes of degree 3. These nodes are involved in forks (in red) that must be pruned to recover possible backbone threading. (b) When a fork is detected, the edges of the fork are temporarily removed, which creates 3 possible path graphs (P1, P2 and P3). (c) The shortest path graph (P2) is removed to solve the fork. However, a pruning threshold (Tp) is defined to avoid the removal of large fragments. If the length of the path graph is lower than this threshold, the path graph is removed, and the fork is solved. (d) In the case in which the length of the shortest path graph is higher than Tp, the fork nodes are simply deleted and more fragments are generated.
Figure 2
Figure 2
Overview of the automatic reconstruction of an atomic protein structure from an EM density map. (a) Original EM density map used as input of the algorithm. (b) Minimum spanning tree (MSTree) derived from the EM density map. (c) Fragments resulting from the fork pruning procedure of the MSTree. (d) Chains built from the fragments. Fragments were merged in a way to maximize the overlap with predicted contacts. Chains A, B, and C were detected automatically without any prior segmentation of the EM density map. (e) Segmented map built from the threading of the 3 chains depicted in (d). (f) Full-atom model derived from the Cα tracing in (d) with Modeller and the real_space_refine tool from the Phenix software suite.
Figure 3
Figure 3
Fragments resulting from the map threading (bottom lines) and aligned on the reference model 4CI0 (upper lines) for the 3 chains (AC). The red and yellow boxes indicate α-helices and β-strands, respectively, in the reference model. The black lines indicate the nearest Cα atom in space from the fragment to the reference model. Crossed line bundles indicate fragments that have been reversed with respect to the originally predicted direction of the graph.
Figure 4
Figure 4
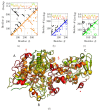
Overlap between predicted contact maps and contact map of the final model. Predicted contact maps (upper diagonals, in black) with a probability cutoff of 0.5, are compared with the final contact maps of chain A, B, and C ((a), (b) and (c), respectively) resulting from fragment merging (lower diagonal in orange, blue, and green, respectively) with a distance cutoff of 8 ÅṪhe upper projection gives the overlap ratio between the contact map of the model and the predicted contact map. An overlap of 1 means that all predicted contacts are satisfied by the model. The overlap is computed for sliding fragments of 11 residues along the sequence. (d) Projection of the contact map overlap on the generated model, colored from red (overlap 0) to green (overlap 1). Three regions, highlighted by symbols †, § and * for chains A, B, and C, respectively, having very sparse predicted contacts display very low overlap scores, indicating that the sequence assignment for these regions on the final model is potentially incorrect.
Figure 5
Figure 5
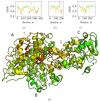
Structural alignment and comparison with the reference structure 4CI0. (ac) Deviations of the final model for each of the Cα atoms from the 4CI0 structure aligned on the model, for chains A, B, and C, respectively. (d) Final model with Cα deviations projected onto the structure using the same color map as for graphs (ac). Symbols †, §  and * highlight regions in the structure with high deviations from the reference structure for chains A, B, and C, respectively.
Figure 6
Figure 6
Segment Manders’ overlap coefficient (SMOC) of the refined model against the EM density map EMD-2513 used as input for the atomic scale reconstruction method. (ac) SMOC profiles along the protein sequence of chain A, B, and C, respectively. (d) The corresponding SMOC values are projected on the obtained full-atom model. The color scale highlights poorly fitted regions in red. Symbols † and § indicate two of the tree regions previously identified as having high deviation from the reference structure.
Figure 7
Figure 7
Modified methodology to determine the structure of the wedge complex of the bacterial type 6 secretion system (T6SS) baseplate. (a) Initial model manually built in the EM density map. (b) Corrected model using predicted contacts. Gray lines correspond to contacts predicted by RaptorX, mostly unsatisfied in the initial model. The rainbow color of the backbone reports the residue index, where N-terminal residues are blue, and C-terminal residues are red. (c) Final atomic model docked in the EM map to the wedge complex. (d) Topology of the initial model depicted in (a). (e) Topology of the corrected model depicted in (b). The red part highlights the major topology changes made by the method (fragmentation/concatenation). The gray scale encodes the sequence offset introduced by the method: white secondary structure elements have no offset with respect to corresponding secondary structure of the initial topology, light gray elements have an offset of about 10 residues, dark gray have an offset of about 100 residues. (f) Contacts of the initial model (orange) aligned on the predicted contacts (blue). (g) Contacts of the final model (orange) aligned on the predicted contacts (blue).

References

    1. Radermacher M., Wagenknecht T., Verschoor A., Frank J. Three-dimensional structure of the large ribosomal subunit from Escherichia coli. Embo J. 1987;6:1107–1114. doi: 10.1002/j.1460-2075.1987.tb04865.x. - DOI - PMC - PubMed
    1. DiMaio F., Chiu W. Tools for Model Building and Optimization into Near-Atomic Resolution Electron Cryo-Microscopy Density Maps. Methods Enzymol. 2016;579:255–276. doi: 10.1016/bs.mie.2016.06.003. - DOI - PMC - PubMed
    1. Kühlbrandt W. The resolution revolution. Science. 2014;343:1443–1444. doi: 10.1126/science.1251652. - DOI - PubMed
    1. Nakane T., Kotecha A., Sente A., McMullan G., Masiulis S., Brown P., Grigoras I.T., Malinauskaite L., Malinauskas T., Miehling J., et al. Single-particle cryo-EM at atomic resolution. Nature. 2020;587:152–156. doi: 10.1038/s41586-020-2829-0. - DOI - PMC - PubMed
    1. Kucukelbir A., Sigworth F.J., Tagare H.D. Quantifying the local resolution of cryo-EM density maps. Nat. Methods. 2014;11:63–65. doi: 10.1038/nmeth.2727. - DOI - PMC - PubMed

Publication types

LinkOut - more resources