. 2022 Sep 13;12(9):1294.
doi: 10.3390/biom12091294.

Comparative Transcriptomic Analysis of mRNAs, miRNAs and lncRNAs in the Longissimus dorsi Muscles between Fat-Type and Lean-Type Pigs

Affiliations

Comparative Transcriptomic Analysis of mRNAs, miRNAs and lncRNAs in the Longissimus dorsi Muscles between Fat-Type and Lean-Type Pigs

Jian Zhang et al. Biomolecules. .

Abstract

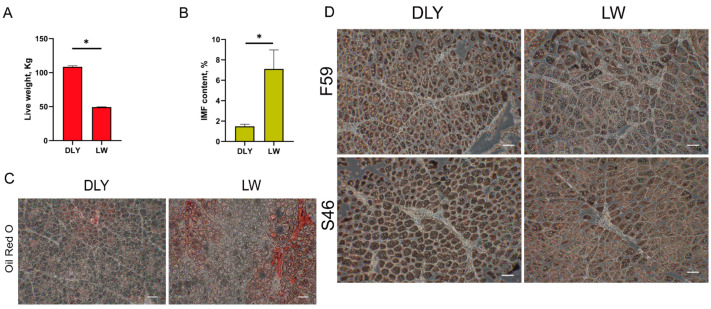
In pigs, meat quality and production are two important traits affecting the pig industry and human health. Compared to lean-type pigs, fat-type pigs contain higher intramuscular fat (IMF) contents, better taste and nutritional value. To uncover genetic factors controlling differences related to IMF in pig muscle, we performed RNA-seq analysis on the transcriptomes of the Longissimus dorsi (LD) muscle of Laiwu pigs (LW, fat-type pigs) and commercial Duroc × Landrace × Yorkshire pigs (DLY, lean-type pigs) at 150 d to compare the expression profiles of mRNA, miRNA and lncRNA. A total of 225 mRNAs, 12 miRNAs and 57 lncRNAs were found to be differentially expressed at the criteria of |log2(foldchange)| > 1 and q < 0.05. The mRNA expression of LDHB was significantly higher in the LD muscle of LW compared to DLY pigs with log2(foldchange) being 9.66. Using protein interaction prediction method, we identified more interactions of estrogen-related receptor alpha (ESRRA) associated with upregulated mRNAs, whereas versican (VCAN) and proenkephalin (PENK) were associated with downregulated mRNAs in LW pigs. Integrated analysis on differentially expressed (DE) mRNAs and miRNAs in the LD muscle between LW and DLY pigs revealed two network modules: between five upregulated mRNA genes (GALNT15, FKBP5, PPARGC1A, LOC110258214 and LOC110258215) and six downregulated miRNA genes (ssc-let-7a, ssc-miR190-3p, ssc-miR356-5p, ssc-miR573-5p, ssc-miR204-5p and ssc-miR-10383), and between three downregulated DE mRNA genes (IFRD1, LOC110258600 and LOC102158401) and six upregulated DE miRNA genes (ssc-miR1379-3p, ssc-miR1379-5p, ssc-miR397-5p, ssc-miR1358-5p, ssc-miR299-5p and ssc-miR1156-5p) in LW pigs. Based on the mRNA and ncRNA binding site targeting database, we constructed a regulatory network with miRNA as the center and mRNA and lncRNA as the target genes, including GALNT15/ssc-let-7a/LOC100523888, IFRD1/ssc-miR1379-5p/CD99, etc., forming a ceRNA network in the LD muscles that are differentially expressed between LW and DLY pigs. Collectively, these data may provide resources for further investigation of molecular mechanisms underlying differences in meat traits between lean- and fat-type pigs.

Keywords: Longissimus dorsi muscle; intramuscular fat; lncRNA; mRNA; miRNA; pig; transcriptome.


Conflict of interest statement

The authors declare no conflict of interest.

Figures

Figure 1
Figure 1
Sample description of the Longissimus dorsi muscle from Duroc × Landrace × Yorkshire (DLY) and Laiwu (LW) pigs. Differences in the live weight (A) and intramuscular fat content (IMF) (B) in the Longissimus dorsi (LD) muscles between LW and DLY pigs. * p < 0.05. (C) Representative images of ORO staining in Longissimus dorsi of DLY and LW pigs (Scale bars, 100 μm). n = 3 biological samples. (D) Immunohistochemical localization of F59 and S46 in Longissimus dorsi of DLY and LW pigs (Scale bars, 100 μm). n = 3 biological samples.
Figure 2
Figure 2
Expression profiles and bioinformatic analysis of DE mRNAs. (A) The volcano plots of the significantly differentially expressed mRNAs at the criteria of |log2(foldchange)| > 1 and q value < 0.05. (B) Heatmap plots of the significantly differentially expressed mRNAs. GO (C) and KEGG (D) analysis diagram of DE mRNAs upregulated in LW pigs. GO (E) and KEGG (F) analysis diagram of DE mRNAs downregulated in LW pigs. (G) Validation by RT-qPCR of 10 randomly selected DE mRNAs from RNA-seq. (H) Heatmap plots of the DE mRNAs in metabolic pathway.
Figure 3
Figure 3
Interaction network for DE mRNAs. (A) Protein-protein interaction of DE mRNAs. The network nodes are proteins and the edges represent the predicted functional associations. (B) The gene interaction network of DE mRNAs by the ingenuity pathway analysis (IPA). The solid line represents direct interaction; dotted line represents indirect interaction.
Figure 4
Figure 4
Expression profiles of DE miRNAs and bioinformatic analysis of their targeted genes. (A) The volcano plots of the significantly differentially expressed miRNAs at the criteria of |log2(foldchange)| > 1 and q value < 0.05. (B) Heatmap plots of the significantly differentially expressed miRNAs. GO (C) and KEGG (D) analysis diagram of the target genes of DE miRNAs downregulated in LW pigs. GO (E) and KEGG (F) analysis diagram of the target genes of DE miRNAs upregulated in LW pigs. (G) Validation by RT-qPCR of 12 DE miRNAs from RNA-seq.
Figure 5
Figure 5
Expression profiles of DE lncRNAs and bioinformatic analysis of its targeted genes. (A) The volcano plots of the significantly differentially expressed lncRNAs at the criteria of |log2(foldchange)| > 1 and q value < 0.05. (B) Heatmap plots of the significantly differentially expressed lncRNAs. GO (C) and KEGG (D) analysis diagram of the cis target genes of DE lncRNAs upregulated in LW pigs. GO (E) and KEGG (F) analysis diagram of the cis target genes of DE lncRNAs downregulated in LW pigs. GO (G) and KEGG (H) analysis diagram of the trans target genes of DE lncRNAs upregulated in LW pigs. GO (I) and KEGG (J) analysis diagram of the trans target genes of DE lncRNAs downregulated in LW pigs. (K) Validation by RT-qPCR of 10 DE lncRNAs from RNA-seq.
Figure 6
Figure 6
mRNA-miRNA network constructed with DE miRNAs and DE mRNAs in the Longissimus dorsi muscle of pigs. (A) Venn plots showing the number of overlapping targeted genes of DE miRNAs and DE mRNAs. (B) Cytoscape showing the interactions of upregulated DE mRNA and downregulated DE miRNA, five mRNAs and six miRNAs are targeted in this sub-network. The red and blue nodes represent mRNAs and miRNAs, respectively. (C) Cytoscape showing the interactions of downregulated DE mRNA and upregulated of DE miRNA; three mRNAs and six miRNAs are targeted in this sub-network. The yellow and blue nodes represent mRNAs and miRNAs, respectively. (D) Verification of the above DE mRNAs. * p < 0.05, ** p < 0.01, *** p < 0.001; ns, not significant.
Figure 7
Figure 7
mRNA–miRNA–lncRNA regulatory networks in the Longissimus dorsi muscle of pigs. Green circulars indicate mRNAs, red diamonds indicate lncRNAs, yellow triangles indicate miRNAs, and the lines represent the targeting interactions between them.
Figure 8
Figure 8
GALNT15 promotes adipogenesis in 3T3-L1 cells. (A) Double enzyme digestion verification of GALNT15 overexpression plasmid. M: DNA marker. Lines 1 and 2: two replicates of pcDNA3.1(+)-GALNT15 plasmid. (B) Representative images of ORO staining in 3T3-L1 cells treated with control (Ctrl) or GALNT15 OE for 48 h (Scale bars, 100 μm). n = 3 biological samples. RT-qPCR analysis of GALNT15 OE for adipogenic marker genes. (C) Representative images of ORO staining in 3T3-L1 cells treated with Ctrl or GALNT15 KD for 48 h (Scale bars, 100 μm). n = 3 biological samples. RT-qPCR analysis of GALNT15 KD for adipogenic marker genes. (D) Representative images of ORO staining in 3T3-L1 cells treated with Ctrl, GALNT15 KD and GALNT15 KD+OE. n = 3 biological samples. Error Bar indicated SEM, * p < 0.05, ** p < 0.01, *** p < 0.001. ns, not significant.

References

    1. Chang K.C., Da Costa N., Blackley R., Southwood O., Evans G., Plastow G., Wood J.D., Richardson R.I. Relationships of Myosin Heavy Chain Fibre Types to Meat Quality Traits in Traditional and Modern Pigs. Meat Sci. 2003;64:93–103. doi: 10.1016/S0309-1740(02)00208-5. - DOI - PubMed
    1. Joo S.T., Kim G.D., Hwang Y.H., Ryu Y.C. Control of Fresh Meat Quality through Manipulation of Muscle Fiber Characteristics. Meat Sci. 2013;95:828–836. doi: 10.1016/j.meatsci.2013.04.044. - DOI - PubMed
    1. Hausman G.J., Basu U., Du M., Fernyhough-Culver M., Dodson M.V. Intermuscular and Intramuscular Adipose Tissues: Bad vs. Good Adipose Tissues. Adipocyte. 2014;3:242–255. doi: 10.4161/adip.28546. - DOI - PMC - PubMed
    1. Schiaffino S., Reggiani C. Fiber Types in Mammalian Skeletal Muscles. Physiol. Rev. 2011;91:1447–1531. doi: 10.1152/physrev.00031.2010. - DOI - PubMed
    1. Qaisar R., Bhaskaran S., Van Remmen H. Muscle Fiber Type Diversification during Exercise and Regeneration. Free Radic. Biol. Med. 2016;98:56–67. doi: 10.1016/j.freeradbiomed.2016.03.025. - DOI - PubMed

Publication types