. 2022 Sep 17;12(18):2458.
doi: 10.3390/ani12182458.

Does the Domestication Syndrome Apply to the Domestic Pig? Not Completely

Affiliations

Does the Domestication Syndrome Apply to the Domestic Pig? Not Completely

Edoardo Collarini et al. Animals (Basel). .

Abstract

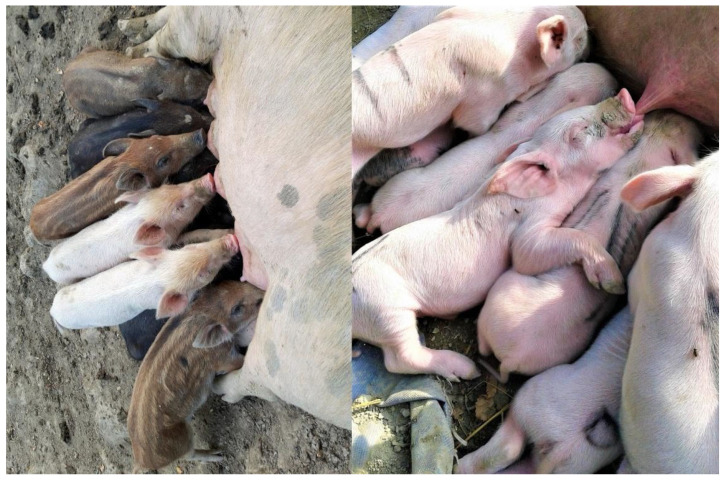
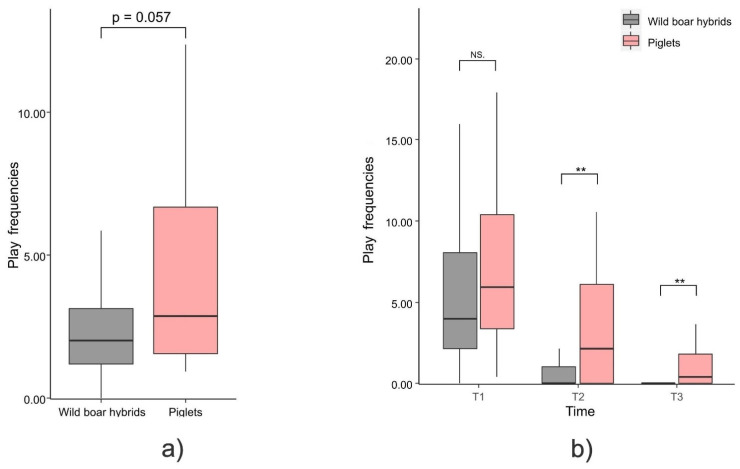
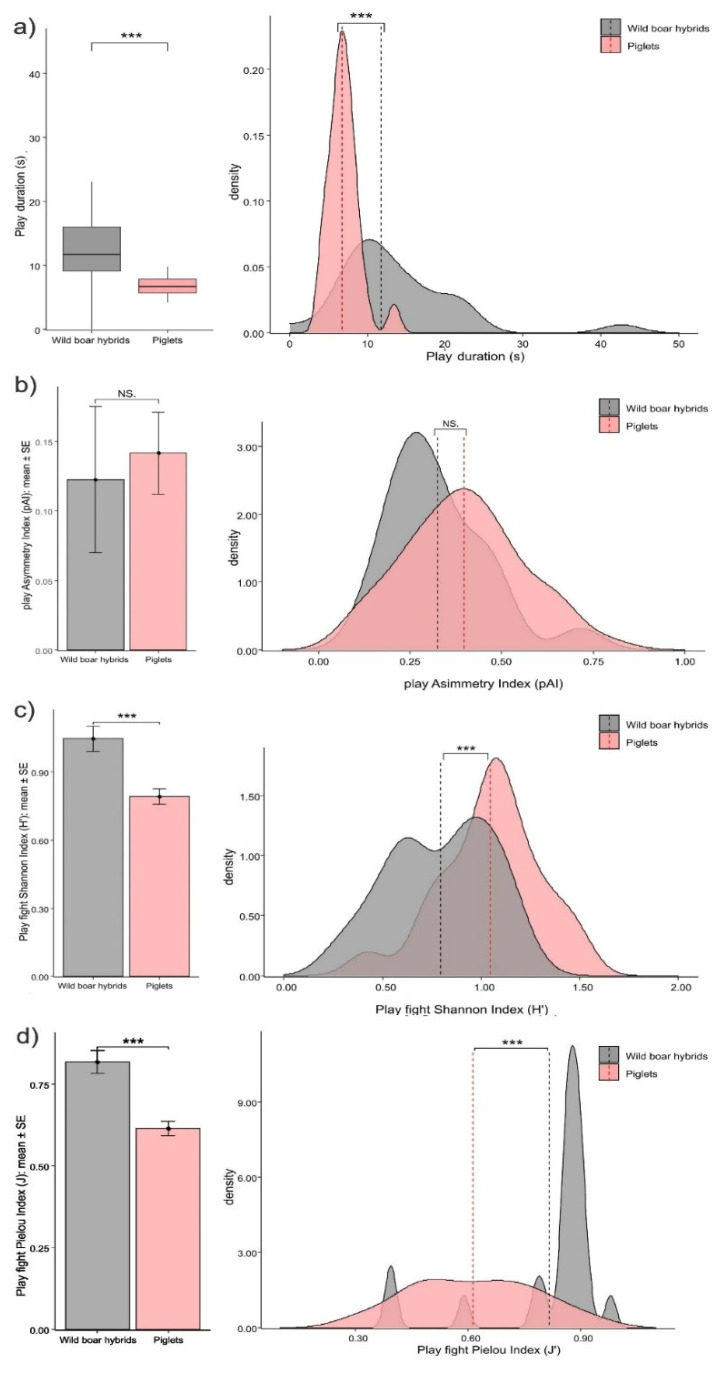
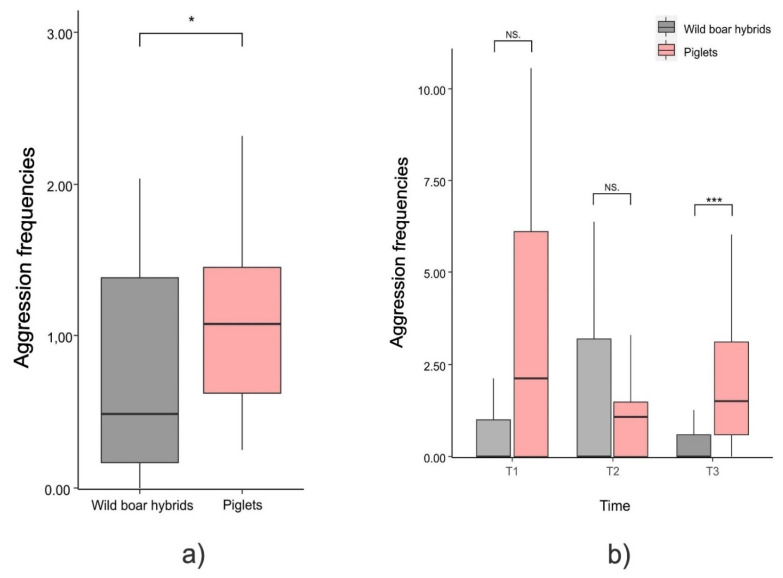
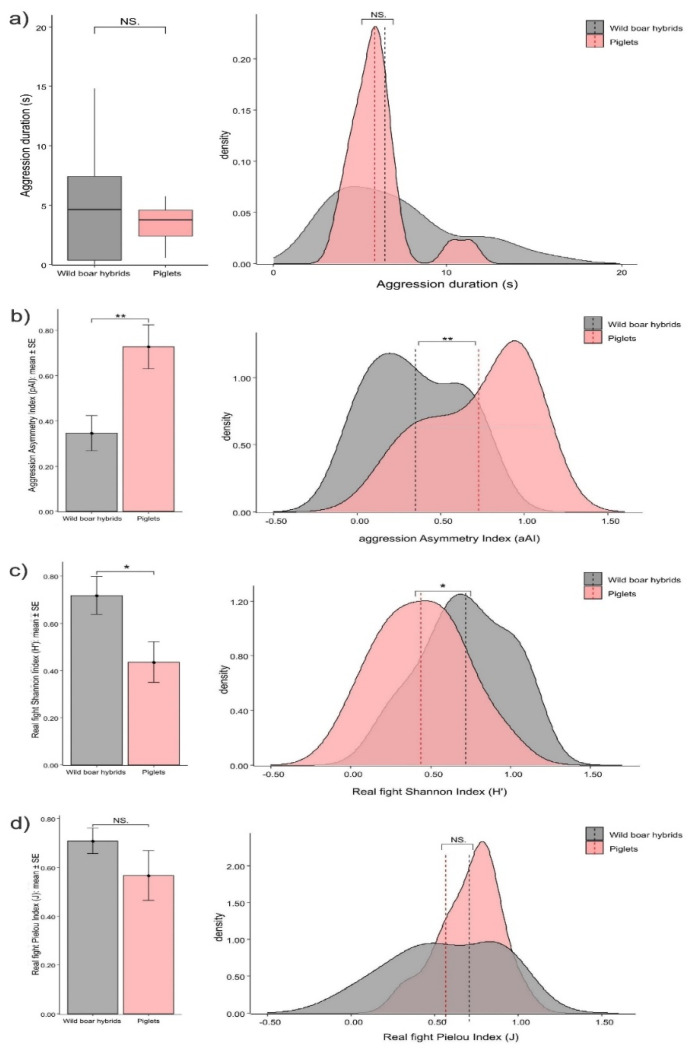
The 'domestication syndrome' defines a suite of features that domesticated animals possess as the result of the artificial selection operated by Homo sapiens since the Neolithic. An interesting anthropological question is whether such features, including increased tameness and reduced aggression, apply to all domesticated forms. We investigated this issue in the domestic pig (Sus scrofa). We video-recorded and analysed aggression and social play (mostly play-fighting) sessions from piglets (three litters; n = 24) and wild boar hybrids (domestic pig mother x wild boar father; three litters; n = 27) from 6-50 days of age, raised in the same woodland/grassland habitat and extensive farming management (ethical farm 'Parva Domus', Cavagnolo, Torino). Play and aggression session structure was assessed via Asymmetry (AI; offensive/defensive pattern balance), Shannon (H'; pattern variability), and Pielou (J; pattern evenness) indices. We found that piglets played more (especially after the 20th day of life) and engaged in less variable and uniform sessions than wild boar hybrids. Compared to hybrids, piglets showed less variable but more frequent (especially when approaching weaning) and asymmetrical aggressive events. Thus, the domestication syndrome does not seem to fully apply to either social play or aggression, possibly because artificial selection has produced greater tameness of pigs towards humans than towards conspecifics.

Keywords: Homo sapiens; Neolithic; Sus scrofa; aggression; artificial selection; domestication; livestock; new stone age; play; swine.


Conflict of interest statement

The authors declare no conflict of interest.

Figures

Figure 1
Figure 1
Wild boar hybrids (left) and piglets (right) during lactation (piglets are marked for individual identification).
Figure 2
Figure 2
Box plot showing that: (a) the overallsocial play frequency tends to be higher in piglets than wild boar hybrids for the whole period (Mann–Whitney exact test; p = 0.057); (b) social play hourly frequencies (age periods: T1 = 6–20 days, T2 = 21–35 days, T3 = 36–50 days) are higher in piglets in T2 (Mann–Whitney exact test; p = 0.006) and in T3 (Mann–Whitney exact test; p = 0.001). There was a significant decrease in the social play levels across periods for both hybrids and piglets (Friedman’s tests, p < 0.05) and particularly between T1 and T2/T3 (Dunn’s tests: p < 0.05). Horizontal line: median value; box: interquartile range; vertical line: minimum and maximum values in the data. NS = non-significant, ** = p < 0.01.
Figure 3
Figure 3
Differences in the duration of the play sessions between piglets and wild boar hybrids shown as bar plot (left) and density plot (right). (a) Piglets show shorter play sessions (Mann–Whitney exact test; p < 0.001). Density plot: vertical, dashed lines indicate median value. Bar plot: horizontal line: median value; box: interquartile range, vertical line: minimum and maximum values in the data. Differences in play fighting between piglets and wild boar hybrids are shown as error bar plot (left) and density plot (right). (b) Asymmetry Index (pAI) values; piglets and wild boar hybrids show comparable levels of asymmetry (t-test for independent samples; p = 0.753). (c) Shannon Index (H′) values; piglets show the lowest levels of play fight variability (t-test for independent samples; p < 0.001). (d) Pielou Index (J) values; piglets show the lowest levels of evenness in play fight (evenness) (t-test for independent samples; p < 0.001). Density plot: vertical, dashed lines indicate mean value. Density plot: vertical, dashed lines indicate mean value. Error bar plot: vertical bars; Standard Error (SE) around the mean (circles). NS = non-significant, *** = p < 0.001.
Figure 4
Figure 4
Box plot showing that: (a) the overall frequency of aggression are significantly higher than in piglets lower wild boar hybrids for the whole period (Mann–Whitney exact test; p = 0.017); (b) aggression hourly frequencies (age periods: T1 = 6–20 days, T2 = 21–35 days, T3 = 36–50 days) are higher in piglets in T3 (Mann–Whitney exact test; p < 0.001) but not in the other periods. No variation was observed across periods (T1–T3) in both hybrids and piglets (Friedman’s test; p = ns). Horizontal line: median value; box: interquartile range; vertical line: minimum and maximum values in the data. NS = non-significant, * = p < 0.05, *** = p < 0.001.
Figure 5
Figure 5
Differences in aggression duration between piglets and wild boar hybrids shown as bar plot (left) and density plot (right). (a) Piglets and wild boar hybrids show comparable levels in the aggression duration (Mann–Whitney exact test; p = 0.539) Density plot: vertical, dashed lines indicate median value. Bar plot: horizontal line: median value; box: interquartile range; vertical line: minimum and maximum values in the data. Difference in real fighting between piglets and wild boar hybrids shown as error bar plot (left) and density plot (right). (b) Asymmetry Index (aAI) values; piglets show top levels of asymmetry (t-test for independent samples; p = 0.007). (c) Shannon Index (H′) values; piglets show the lowest levels of real fight variability (t-test for independent samples; p = 0.027). (d) Pielou Index (J) values; piglets and wild boar hybrids show comparable levels of real fighting in the Pielou Index (evenness) (t-test for independent samples; p = 0.239). Density plot: vertical, dashed lines indicate mean value. Bar plot: vertical bars. Standard Error (SE) around the mean (circles). NS = non-significant, * = p < 0.05, ** = p < 0.01.

References

    1. Mignon-Grasteau S., Boissy A., Bouix J., Faure J.-M., Fisher A.D., Hinch G.N., Jensen P., Le Neindre P., Mormède P., Prunet P., et al. Genetics of Adaptation and Domestication in Livestock. Livest. Prod. Sci. 2005;93:3–14. doi: 10.1016/j.livprodsci.2004.11.001. - DOI
    1. Price E.O. Behavioral Aspects of Animal Domestication. Q. Rev. Biol. 1984;59:1–32. doi: 10.1086/413673. - DOI
    1. Trut L., Oskina I., Kharlamova A. Animal Evolution during Domestication: The Domesticated Fox as a Model. Bioessays. 2009;31:349–360. doi: 10.1002/bies.200800070. - DOI - PMC - PubMed
    1. Clutton-Brock J. The Process of Domestication. Mamm. Rev. 1992;22:79–85. doi: 10.1111/j.1365-2907.1992.tb00122.x. - DOI
    1. Zeder M.A. The Domestication of Animals. J. Anthropol. Res. 2012;68:161–190. doi: 10.3998/jar.0521004.0068.201. - DOI

LinkOut - more resources