. 2022 Sep 12;11(18):2844.
doi: 10.3390/cells11182844.

Macrophages Upregulate Estrogen Receptor Expression in the Model of Obesity-Associated Breast Carcinoma

Affiliations

Macrophages Upregulate Estrogen Receptor Expression in the Model of Obesity-Associated Breast Carcinoma

Daniela Nahmias Blank et al. Cells. .

Abstract

Breast cancer (BC) and obesity are two heterogeneous conditions with a tremendous impact on health. BC is the most commonly diagnosed neoplasm and the leading cause of cancer-related mortality among women, and the prevalence of obesity in women worldwide reaches pandemic proportions. Obesity is a significant risk factor for both incidence and worse prognosis in estrogen receptor positive (ER+) BC. Yet, the mechanisms underlying the association between excess adiposity and increased risk/therapy resistance/poorer outcome of ER+, but not ER-negative (ER-), BC are not fully understood. Tumor-promoting action of obesity, predominantly in ER + BC patients, is often attributed to the augmented production of estrogen in 'obese' adipose tissue. However, in addition to the estrogen production, expression levels of ER represent a key determinant in hormone-driven breast tumorigenesis and therapy response. Here, utilizing in vitro and in vivo models of BC, we show that macrophages, whose adverse activation by obesogenic substances is fueled by heparanase (extracellular matrix-degrading enzyme), are capable of upregulating ER expression in tumor cells, in the setting of obesity-associated BC. These findings underscore a previously unknown mechanism through which interplay between cellular/extracellular elements of obesity-associated BC microenvironment influences estrogen sensitivity-a critical component in hormone-related cancer progression and resistance to therapy.

Keywords: breast cancer; estrogen; estrogen receptor α; heparanase; macrophages; obesity.


Conflict of interest statement

The authors declare no potential conflicts of interest.

Figures

Figure 1
Figure 1
Upregulation of ERα in obesity-associated murine breast carcinoma model. Female C57BL6 mice fed for 12 weeks with either HFD (obese) or control diet (lean), were injected with E0771 cells into the 4th mammary fat pad of all mice, as described in Methods. Tumors were harvested 14 days post cell injection and lysates of tumor tissue derived from lean and obese mice were analyzed for ERα expression by immunoblotting and qRT-PCR. (A) Protein levels of full length 66 kDa ERα in the orthotopic E0771 tumors derived from lean and obese. (B) The band intensity was quantified using ImageJ software; intensity ratio for ERα/GAPDH is shown, n ≤ 4 mice per condition. (C) qRT-PCR was used to determine the levels of ERα mRNA in tumor tissue samples collected from lean and obese mice. Error bars represent ± SD. * p < 0.04; ** p < 0.001.
Figure 2
Figure 2
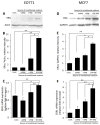
Upregulation of ERα expression in murine and human BC cells by SFA-stimulated macrophages. E0771 (AC) and MCF-7 (DF) BC cells either remained untreated (Cont.) or were incubated (24 h, 37 °C) with medium conditioned by either unstimulated macrophages (usMϕ), or macrophages stimulated (16 h) by vehicle (BSA) alone (v·Mϕ) or by SFA (i.e., palmitic acid) conjugated with fatty acid free-BSA at a 2:1 molar ratio (SFA·Mϕ). (A,D) ERα protein levels were determined by immunoblotting. (B,E) The band intensity was quantified using ImageJ software; intensity ratio for ERα/actin or ERα/GAPDH is shown. (C,F) The expression of mouse (C) and human (F) ESR1 gene, encoding for ERα, was determined by qRT-PCR. The data shown are representative of ≥3 independent experiments; error bars represent ± SD. * p < 0.02; ** p < 0.0015.
Figure 3
Figure 3
Ability of macrophages to upregulate ER expression in BC cells in response to stimulation by obese milieu components depends on TLR4 signaling. (A,B). Mouse E0771 (A) and human MCF7 (B) BC cells either remained untreated (Cont.) or were incubated (24 h, 37 °C) with medium conditioned by macrophages stimulated with 200 µM SFA (i.e., palmitic acid), alone (SFA·Mϕ) or in the presence of 30 µM of TLR4-specific inhibitor TAK-242 (SFA·Mϕ + TAK). ERα protein levels were determined by immunoblotting (top) and quantified using ImageJ software (bottom); the intensity ratio for ERα/GAPDH is shown. (C,D). Macrophages stimulated by conditions mimicking metabolic endotoxemia upregulated ERα expression in BC cells. E0771 (C) and MCF7 (D) cells were either remained untreated (Cont.) or were incubated (24 h, 37 °C) with medium conditioned by macrophages stimulated by 0.1 ng/mL LPS alone (LPS·Mϕ) or in the presence of 30 µM of TLR4-specific inhibitor TAK-242 (LPS·Mϕ + TAK). ERα protein levels were determined by immunoblotting (top) and quantified using ImageJ software (bottom). The intensity ratio for ERα/GAPDH is shown. The data are representative of 3 independent experiments; error bars represent ± SD. * p < 0.007; ** p < 0.0009.
Figure 4
Figure 4
Effect of SFA-stimulated macrophages on estrogen sensitivity of MCF7 cells. Prior to estrogen treatment, MCF7 cells were maintained for 2 weeks in phenol red–free medium supplemented with charcoal-stripped FCS (5%), and then incubated (96 h, 37 °C) with the medium conditioned by either unstimulated macrophages (Cont), or macrophages stimulated (16 h) by vehicle (BSA) alone (v·Mϕ) or by 200 µM palmitate (SFA) conjugated with fatty acid free-BSA at a 2:1 molar ratio (SFA·Mϕ), in the absence (white bars) or presence (black bars) of 10−9 M estradiol (E2). Cell proliferation was analyzed by MTS assay, * p < 0.02, ** p < 0.003; n.s: no statistical difference. Error bars represent ± SD.
Figure 5
Figure 5
Heparanase deficiency abolishes effect of obesity on ERα expression in the murine model of BC. Wild-type (wt) and heparanase-null (Hpse−KO) female C57BL6 mice were made obese by administration of HFD for 12 consecutive weeks, as described in Methods. Control (lean) mice were feed with a regular diet. HFD-fed animals of both wt and Hpse−KO genotypes became obese, as evidenced by their significantly increased body weight compared to control diet-fed lean mice (wt: 38% increase p < 0.001; Hpse−KO: 49% increase, p < 0.03). Then, all mice were injected with E0771 cells into the 4th mammary fat pad, as described in Methods. Tumors were harvested 14 days post cell injection and lysates of tumor tissue were analyzed for expression of ERα protein (A,B) and mRNA (C). (A,B) Levels of full length 66 kDa ERα protein in the orthotopic E0771 tumors derived from lean and obese mice, were analyzed by immunoblotting (A). The band intensity was quantified using ImageJ software; intensity ratio for ERα/GAPDH is shown, n ≤ 5 mice per condition (B). Error bars represent ± SD; * p < 0.0002; n.s: no statistical difference. (C) qRT-PCR was used to determine the levels of ERα mRNA in tumor tissue samples collected from lean and obese mice.
Figure 6
Figure 6
Heparanase-deficient macrophages stimulated by SFA failed to upregulate ERα levels in BC cells. E0771 (A) and T47D (B) cells either remained untreated (Cont.) or were incubated (24 h, 37 °C) with medium conditioned by macrophages derived from either wild-type (wtMϕ) or heparanase-knockout (Hpse-/- Mϕ) mice, and stimulated by saturated fatty acid, either palmitic (A) or stearic (B), as described in Methods. ERα protein levels were determined by immunoblotting (top) and quantified using ImageJ software (bottom). Error bars represent ± SD. * p < 0.002.
Figure 7
Figure 7
Sections of human ER + BC tissue samples (n = 58) were processed for immunohistochemistry with anti-ERα and anti-heparanase (Hpse) antibodies, as described in Methods. Inset: representative images of heparanase-positive (top) and heparanase-negative (bottom) breast tumor tissue specimens (invasive ductal carcinoma), original magnification ×200. To define tumor as Hpse-positive, a cutoff point of 25% immuno-stained tumor cells was used, as in Ref. [53]. The intensity of ERα staining was scored as weak (1), moderate (2), or strong (3), as described in Methods; tumors with staining score 1 were categorized as “low ER” (black bars); tumors with staining score 2 and 3 as “high ER” (grey bars). Chi-squared analysis was then used to assess the relationship between heparanase positivity and high versus low ER levels. Significant correlation between expression of heparanase and high ER levels was noted:an almost 2-fold higher proportion of high ER expression was detected in heparanase-positive versus heparanase-negative tumors (73% vs. 40%, chi-square test * p = 0.0135).

References

    1. Siegel R.L., Miller K.D., Jemal A. Cancer statistics, 2019. CA Cancer J. Clin. 2019;69:7–34. doi: 10.3322/caac.21551. - DOI - PubMed
    1. Prat A., Pineda E., Adamo B., Galvan P., Fernandez A., Gaba L., Diez M., Viladot M., Arance A., Munoz M. Clinical implications of the intrinsic molecular subtypes of breast cancer. Breast. 2015;24((Suppl. S2)):S26–S35. doi: 10.1016/j.breast.2015.07.008. - DOI - PubMed
    1. Cancer Genome Atlas N. Comprehensive molecular portraits of human breast tumours. Nature. 2012;490:61–70. doi: 10.1038/nature11412. - DOI - PMC - PubMed
    1. Caan B.J., Sweeney C., Habel L.A., Kwan M.L., Kroenke C.H., Weltzien E.K., Quesenberry C.P., Jr., Castillo A., Factor R.E., Kushi L.H., et al. Intrinsic subtypes from the PAM50 gene expression assay in a population-based breast cancer survivor cohort: Prognostication of short- and long-term outcomes. Cancer Epidemiol. Biomark. Prev. 2014;23:725–734. doi: 10.1158/1055-9965.EPI-13-1017. - DOI - PMC - PubMed
    1. Piperigkou Z., Karamanos N.K. Estrogen receptor-mediated targeting of the extracellular matrix network in cancer. Semin. Cancer Biol. 2020;62:116–124. doi: 10.1016/j.semcancer.2019.07.006. - DOI - PubMed

Publication types

LinkOut - more resources