. 2022 Sep 10;14(18):4403.
doi: 10.3390/cancers14184403.

A Panax quinquefolius-Based Preparation Prevents the Impact of 5-FU on Activity/Exploration Behaviors and Not on Cognitive Functions Mitigating Gut Microbiota and Inflammation in Mice

Affiliations

A Panax quinquefolius-Based Preparation Prevents the Impact of 5-FU on Activity/Exploration Behaviors and Not on Cognitive Functions Mitigating Gut Microbiota and Inflammation in Mice

Renaud Parment et al. Cancers (Basel). .

Abstract

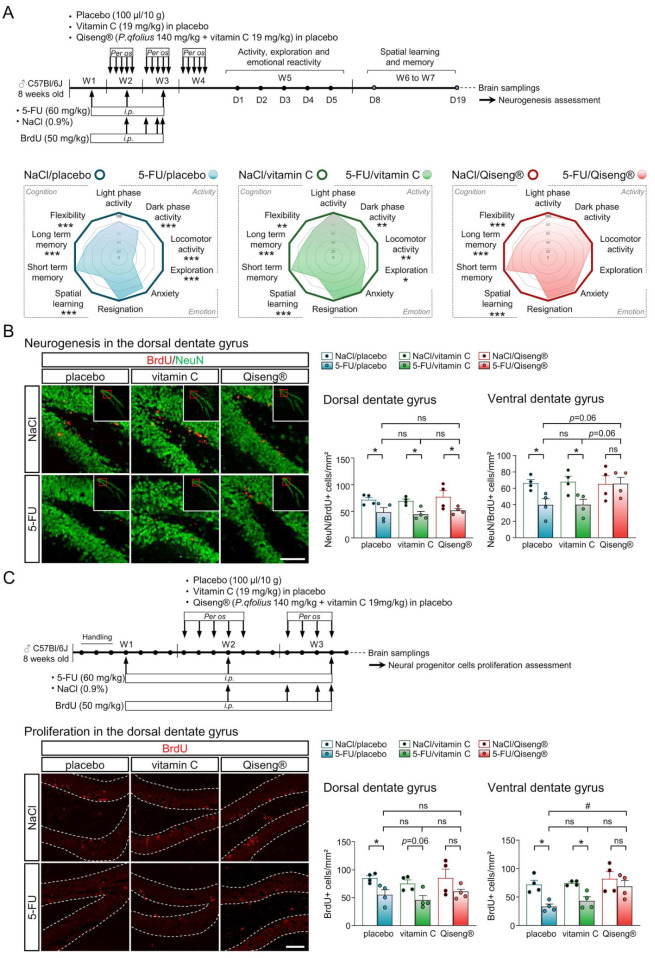
Chemotherapy-related cognitive impairment (CRCI) and fatigue constitute common complaints among cancer patient survivors. Panax quinquefolius has been shown to be effective against fatigue in treated cancer patients. We developed a behavioral C57Bl/6j mouse model to study the role of a Panax quinquefolius-based solution containing vitamin C (Qiseng®) or vitamin C alone in activity/fatigue, emotional reactivity and cognitive functions impacted by 5-Fluorouracil (5-FU) chemotherapy. 5-FU significantly reduces the locomotor/exploration activity potentially associated with fatigue, evokes spatial cognitive impairments and leads to a decreased neurogenesis within the hippocampus (Hp). Qiseng® fully prevents the impact of chemotherapy on activity/fatigue and on neurogenesis, specifically in the ventral Hp. We observed that the chemotherapy treatment induces intestinal damage and inflammation associated with increased levels of Lactobacilli in mouse gut microbiota and increased expression of plasma pro-inflammatory cytokines, notably IL-6 and MCP-1. We demonstrated that Qiseng® prevents the 5-FU-induced increase in Lactobacilli levels and further compensates the 5-FU-induced cytokine release. Concomitantly, in the brains of 5-FU-treated mice, Qiseng® partially attenuates the IL-6 receptor gp130 expression associated with a decreased proliferation of neural stem cells in the Hp. In conclusion, Qiseng® prevents the symptoms of fatigue, reduced chemotherapy-induced neuroinflammation and altered neurogenesis, while regulating the mouse gut microbiota composition, thus protecting against intestinal and systemic inflammation.

Keywords: IL-6; Panax quinquefolius-based solution; activity and exploration; behavioral mouse model; chemotherapy; cognitive functions; gut microbiota; intestinal inflammation.


Conflict of interest statement

Renaud Parment, Martine Dubois, Laurence Desrues, Alexandre Mutel, Kléouforo-Paul Dembélé, Nicolas Belin, Laure Tron, Pascal Hilber, Moïse Coëffier, Vincent Compère and David Ribet have no biomedical financial interests or no conflicts of interest to declare. Pr Florence Joly reports having received lecture and consulting fees from Janssen-Cilag, Astellas Pharma, Bayer, Sanofi and research funding from Astellas Pharma. Hélène Castel reports having received research funding from Laboratoire Natsuca. The funders had no role in the design of the study; in the collection, analyses, or interpretation of data; in the writing of the manuscript, or in the decision to publish the results”. Céline Féger provided expert review of the written paper.

Figures

Figure 1
Figure 1
Preventive impact of Qiseng® on the behavioral consequences of 5-FU for spontaneous activity and exploration and nycthemeral rhythms and activity. (A) Schematic representation of the schedule and experimental protocol showing the timeline for the different treatments and behavior tests assessing emotional reactivity and cognitive functions in mice. C57BL/6J Rj mice received intraperitoneal injection of 5-FU (60 mg/kg, red arrow) once a week for 3 weeks (i.p., arrow) and/or per os administration of Placebo, vitamin C (19 mg/kg) in placebo or Qiseng® (P. qfolius 140 mg/kg + vitamin C 19 mg/kg) once a day, 5 times a week for 3 weeks. Mice also received consecutive BrdU injections (50 mg/kg, once a day for 4 days, arrow) in weeks 2 and 3. Behavioral evaluations started at week 4 (W4), with the first group of mice evaluated in the open field test (OFT) on D1, elevated plus maze (EPM) on D2, light/dark box test (LDB) on D3, tail suspension test (TST) on D4 and forced swim test (FST) on D5. Cognitive functions were investigated at W6 and W7, and mouse brains were collected at D19. For a second series of experiments, mice were individually housed from D1 of W4 and evaluated in the sucrose preference test (D2 to D5) followed by testing in actimetry (D5 to D9). (B) Curves of body weight gain during the different treatment periods. NaCl/placebo (n = 22), 5-FU/placebo (n = 24), NaCl/vitamin C (n = 23), 5-FU/vitamin C (n = 23), NaCl/Qiseng® (n = 21), 5-FU/Qiseng® (n = 24). Bi-directional repeated-measures ANOVA; * p < 0.05, ** p < 0.01, *** p < 0.001. (C) Percentage of mortality occurring over the course of the 5-FU injection in the absence or the presence of placebo, vitamin C or Qiseng®. (D) Impact of 5-FU in the absence or the presence of vitamin C or Qiseng® on spontaneous activity and exploration in OFT (D), nycthemeral rhythms, light and dark phase activity (E) or spontaneous exploratory activity in the LDB (F). 5-FU/placebo and 5-FU/vitamin C mice showed reduced spontaneous activity, locomotor exploration and dark phase activity compared with respective NaCl mice. Data distributions are shown in violin plots, with the median in dotted line. NaCl/placebo (D/F: n = 10, E: n = 12), 5-FU/placebo (D/E/F: n = 12), NaCl/vitamin C (D/F: n = 10, E: n = 12), 5-FU/vitamin C (D/E/F: n = 11), NaCl/Qiseng® (D/E/F: n = 10), 5-FU/Qiseng® (D/E/F: n = 12). Kruskal–Wallis-Dunn post hoc; * p < 0.05, ** p < 0.01, *** p < 0.001, ns: not significant. 5-FU: 5-fluorouracil, BrdU: 5-bromo-2’-deoxyuridine, D: Day, W: Week, i.p.: intraperitoneal injection, OFT: open field test, EPM: elevated plus maze, LDB: light/dark box, TST: tail suspension test, FST: forced swim test.
Figure 2
Figure 2
Absence of preventive effect of Qiseng® on the 5-FU-induced alteration of spatial learning, memory and behavioral flexibility. (A) Schematic diagram showing the timeline for treatments and behavioral experiments assessing activity, exploration and emotional reactivity already described in Figure 1 but also the cognitive functions evaluated in the MWMT for the same groups of mice. Mice received one i.p. injection of 5-FU once a week for 3 weeks (arrow), while placebo solution, vitamin C (19 mg/kg) in placebo or Qiseng® (P. qfolius 140 mg/kg + vitamin C 19 mg/kg) were administered per os once a day, 5 times a week for 3 weeks. Mice also received i.p. BrdU injections (50 mg/kg, once a day for 4 days, arrow) in W2 and W3. MWMT was performed over 10 days, starting from W5 with the familiarization on D8, the first learning phase from D9 to D12, the probe test on D12, two hours after learning trials, the retrieval test on D15 and the behavioral flexibility analyzed on D16, followed by the second learning phase from D17 to D19. Animal brains were then collected at the end of D19. (B) Cognitive consequences of 5-FU administration in the absence or the presence of vitamin C or Qiseng for spatial learning location (n = 10–12, bi-directional repeated-measures ANOVA; * p < 0.05, ** p < 0.01, *** p < 0.001). (C) Impact of 5-FU on long-term memory (LT memory) in the absence or the presence of vitamin C or Qiseng®. Data distributions are shown in violin plots, with the median in dotted line (n = 10–12, Kruskal–Wallis-Dunn post hoc; *** p < 0.001). (D) Illustration and classification with an attributed scoring of swimming strategies to localize the platform in the spatial learning and memory, from the lowest to the highest: Thigmotaxis (0) < Scanning (1) < Circling (2) < Focal search (3) < Rotating (4) < Direct swim (5). (E) On the left, schematic representation of platform positioning for each day of the spatial learning phase (D9–D12) of the MWMT: four trials with four different start locations (N, S, W, E) were investigated each day. The Python software (see Materials and Methods) determined the strategy used by the animal to reach the platform in each trial and assigned a score according to the scale described in D (n = 10–12, bi-directional repeated-measures ANOVA; ns: not significant). (F) Effect of 5-FU on the cognitive score during the recall phase (D15). Bars are mean ± SEM (n = 10–12, Kruskal–Wallis-Dunn post hoc; * p < 0.05, ** p < 0.01). On the right, a χ2 test associated with Pearson’s residual test was proposed to extract significant variations in the swimming strategies used by the different groups to localize the platform. The higher the value of Pearson’s residual test, the more frequent is the distribution of score event was when compared to the other groups. Strategies were ranked as in D, from the least to the most efficient ones, to locate the platform. (G) Effect of 5-FU on spatial learning and memory or behavioral flexibility. In the flexibility phase, the position of the platform in the NW quadrant during the learning and recall tests (D9 to D15) was changed to the SE quadrant (D16 to D19). All mice treated with chemotherapy compared with NaCl-treated mice showed an increased latency to find the platform location at D16 (flexibility) during the four trials, also detected at D17, while they learned the new location of the platform from D18 to D19 reaching the level of all NaCl mice. In each analysis, NaCl/placebo (n = 10), 5-FU/placebo (n = 12), NaCl/vitamin C (n = 10), 5-FU/vitamin C (n = 11), NaCl/Qiseng® (n = 10), 5-FU/Qiseng® (n = 12). Bi-directional repeated-measures ANOVA; * p < 0.05, ** p < 0.01, *** p < 0.001). 5-FU: 5-fluorouracil, BrdU: 5-bromo-2’-deoxyuridine, D: day, MWMT: Morris water maze test, LT: Long term.
Figure 3
Figure 3
Preventive effect of Qiseng® on 5-FU-induced altered activity and exploration and decreased precursor proliferation and neurogenesis in ventral and dorsal hippocampus. (A) Schematic representation of the schedule and experimental protocol showing the timeline for treatments and behavior experiments (see Figure 1 and Figure 2). C57BL/6J Rj mice received one injection of 5-FU once a week for 3 weeks (i.p., arrow) and per os administration of placebo solution, vitamin C (19 mg/kg) in placebo or Qiseng® (P. qfolius 140 mg/kg + vitamin C 19 mg/kg) once a day, 5 times a week for 3 weeks. Mice also received i.p. BrdU injections (50 mg/kg, once a day for 4 days, arrow) at W2 and W3. Behavioral evaluations started at W5 to W7. Mouse brains were collected at the end of D19 to evaluate the impact of treatments on neurogenesis in Hp. Radar plots illustrating the impact of all treatments on performance in the activity, emotional and cognitive domains. Each item of the radar represents the mean normalized to the respective NaCl groups, NaCl/placebo (n = 10–11), 5-FU/placebo (n = 12), NaCl/vitamin C (n = 10–12), 5-FU/vitamin C (n = 11), NaCl/Qiseng® (n = 10), 5-FU/Qiseng® (n = 12). * p < 0.05, ** p < 0.01, *** p < 0.001. (B) Representative microphotography of BrdU-(red) and NeuN-(green) positive cells in dHp and vHP from groups studied in Figure 1 and Figure 2. Neurogenesis was evaluated as the number of BrdU+/NeuN+ cells in dHp and vHp. Bars are mean ± SEM with symbols of individual data points. NaCl/placebo (n = 4), 5-FU/placebo (n = 4), NaCl/vitamin C (n = 4), 5-FU/vitamin C (n = 4), NaCl/Qiseng® (n = 4), 5-FU/Qiseng® (n = 4). Kruskal–Wallis-Dunn post hoc; * p < 0.05, ns: not significant). Scale bar: 100 μm. (C) Schematic diagram showing the timeline for treatments. Mice received an i.p. injection of 5-FU once a week for 3 weeks (arrow) and per os administration of placebo, vitamin C (19 mg/kg) in placebo or Qiseng (P. qfolius 140 mg/kg + vitamin C 19 mg/kg) once a day, 5 times a week for 2 weeks. Mice also received four consecutive i.p. BrdU injections (50 mg/kg, arrow) at W2 and W3, and brains were collected at the end of the treatment session. Representative microphotography of BrdU-(red) stained positive cells in the hippocampal dentate gyrus. Bar graphs represent quantification of the number of BrdU+ cells/mm2 in the dentate gyrus of the dorsal (Left) and the ventral (Right) Hp. Mean ± SEM with symbols of individual data points. NaCl/placebo (n = 4), 5-FU/placebo (n = 4), NaCl/vitamin C (n = 4), 5-FU/vitamin C (n = 4), NaCl/Qiseng® (n = 4), 5-FU/Qiseng® (n = 4). Kruskal–Wallis-Dunn post hoc; * p < 0.05, # p < 0.001, ns: not significant). Scale bar: 100 μm. 5-FU: 5-fluorouracil, BrdU: 5-bromo-2′-deoxyuridine, NeuN: Neuronal nuclei antigen.
Figure 4
Figure 4
Detection of ginsenosides and protopanaxadiol in sera of placebo and 5-FU mice treated with Qiseng®. (A) Schematic illustration showing the timeline for treatments and time of serum collection in mice to study the composition in ginsenosides and potential metabolites. C57BL/6J Rj mice received i.p. 5-FU injections once a week for 3 weeks (arrow) and per os placebo, vitamin C or Qiseng® once a day, 5 times a week for 2 weeks. Mice received four BrdU i.p. injections (once a day) at W2 and W3; then, serum and cecum were collected for analysis. (B) HPLC chromatogram and chemoprofile of Qiseng® and some ginsenosides from a 1/10 Qiseng diluted solution (Left) and from a representative example of a NaCl/Qiseng®-treated mouse serum (Right). (C) Relative abundance of Rb1, Rc, Rd, Re, Rg5/Rg6/Rk1, Rg3/F2/RG4/Rf4, Ro, Rg1, F11/Rf ginsenosides in sera of NaCl/Qiseng® and 5-FU/Qiseng®-treated mice. The Rb1, Rd and Rc ginsenosides were predominantly found in sera of both groups, and the Rc ginsenosides proportion was significantly higher in 5-FU/Qiseng® mice. (D) Schematic illustration of the composition of Qiseng® and the potential metabolization by gut microbiota into protopanatriol, protopanaxadiol and Factor K metabolites (Left). Sole protopanaxadiol can be detected in only some serum collected from NaCl/Qiseng® and 5-FU/Qiseng® mice. (E) Percentage of ginsenosides (Left) or Protopanaxadiol (Right) in sera of NaCl/Qiseng® and 5-FU/Qiseng® mice. Data are represented as box plots with the median or bar plots of mean ± SEM with symbols of individual data points. In each analysis, NaCl/Qiseng® (n = 4–7), 5-FU/Qiseng® (n = 4–6). Mann–Whitney; * p < 0.05, ns: not significant). 5-FU: 5-fluorouracil, BrdU: 5-bromo-2′-deoxyuridine, D: Day, W: Week, i.p.: intraperitoneal injection.
Figure 5
Figure 5
Impact of 5-FU, vitamin C and Qiseng® on the abundance of selected species from the gut microbiota. (A) Schematic illustration showing the timeline for treatments and time of serum and cecum collections in mice. (B) Schematic illustration showing the classification and relationships between the different domains, phyla, genera, classes and species of gut bacteria quantified by qPCR. (CG) Relative abundance (RA) of Archaea and Eubacteria (C), Firmicutes, Bacteroidetes and Verrucomicrobia (D), the Lactobacillus genera (E), L. reuteri, L. murinus/animalis, L. acidophilus and L. johnsonii/gasseri species (F) and Betaproteobacteria, Gammaproteobacteria and Deltaproteobacteria (G) from cecal contents of 5-FU/placebo, 5-FU/vitamin C and 5-FU/Qiseng® and their respective NaCl control groups. Data are presented as whisker plots with median, minimum/maximum values and symbols of individual data points. Stars indicate statistical differences within the same group, dollars indicate statistical differences within the vitamin C group, and hashes indicate statistical differences within the placebo group (Kruskal–Wallis-Dunn post hoc; * p < 0.05, # p < 0.05, ## p < 0.01, ### p < 0.001, $ p < 0.05, $$$ p < 0.001, ns: not significant. In each analysis, NaCl/placebo (n = 6–11), 5-FU/placebo (n = 10–11), NaCl/vitamin C (n = 9–11), 5-FU/vitamin C (n = 9–11), NaCl/Qiseng® (n = 10–11), 5-FU/Qiseng® (n = 9–11). (H) Plot of principal component analysis (PCA) of combined data from the abundance of gut bacterial taxa based on dissimilarity among the different NaCl- and 5-FU-treated groups of mice. Both clustering calculations of the relative cluster stability index (RCSI) and elbow methods provided the best score for three clusters (Right). Cluster 1 (red) consisted of NaCl/Qiseng® (all, n = 10), 5-FU/Qiseng® (n = 8) and NaCl/Placebo (n = 3) samples. Cluster 2 (blue/green) included 5-FU/Placebo (n = 9), 5-FU/vitamin C (n = 9), 5-FU/Qiseng® (n = 3), NaCl/vitamin C (n = 3) and NaCl/Placebo (n = 2) samples. Cluster 3 (gray) was composed of NaCl/vitamin C (n = 8), NaCl/Placebo (n = 5), 5-FU/vitamin C (n = 2) and 5-FU/Placebo (n = 1). 5-FU: 5-fluorouracil, L.: Lactobacillus, PCA: principal component analysis, RCSI: relative cluster stability index.
Figure 6
Figure 6
Impact of 5-FU treatment, vitamin C and Qiseng® on intestinal integrity and macrophages infiltration. (A) Schematic timeline for treatments and intestine sampling from the different groups of mice for studying small intestinal tissue integrity. (B) Representative microphotography of eosin/hematoxylin staining from intestinal transversal sections prepared from the NaCl/ and 5-FU/placebo, vitamin C and Qiseng®-treated mice (Left) and intestinal surface and villi height quantifications. Scale bar: 200 μm. Data are represented as bar plots of mean ± SEM with symbols of individual data points (n = 4–5, Kruskal–Wallis-Dunn post hoc; * p < 0.05, ** p < 0.01). (C) Representative microphotography of the monocyte/macrophage specific marker MOMA-2 (red) in villi of small intestine in NaCl/ and 5-FU/placebo, vitamin C and Qiseng®-treated mice. Fluorescence quantification of the effects of 5-FU, vitamin C and Qiseng® on intestinal macrophage infiltration. Bottom left, data are represented as bar plots of mean ± SEM with symbols of individual data points (n = 4–5, Kruskal–Wallis-Dunn post hoc; ** or ## p < 0.01, ### p < 0.001, ns: not significant). Star indicates statistical difference within the same group, and hash indicates statistical difference between 5-FU groups. Scale bar: 100 µm. Bottom right, scatterplot in 3D illustrating the relationships between the MOMA-2 staining, villi height and the intestinal surface from the different treated groups. The negative correlation coefficient of Kendall (###) indicates an increase in intestinal inflammation with a decrease in the intestinal surface and height of villi, specifically evidenced in the 5-FU/Placebo group. In each analysis, NaCl/placebo (n = 4), 5-FU/placebo (n = 5–6), NaCl/vitamin C (n = 4), 5-FU/vitamin C (n = 5–7), NaCl/Qiseng® (n = 4), 5-FU/Qiseng® (n = 5–6). 5-FU: 5-fluorouracil, BrdU: 5-bromo-2’-deoxyuridine, D: Day, W: Week, i.p.: intraperitoneal injection, DAPI: 4′,6-diamidino-2-phenylindole, MOMA2: monocytes and macrophages marker.
Figure 7
Figure 7
Impact of 5-FU in the absence or the presence of placebo, vitamin C or Qiseng® on plasma levels of pro-inflammatory, pluripotent, chemotactic and leukocyte growth cytokines. (A) Schematic timeline of treatments and intestine sampling from the different groups of mice for studying plasma cytokines and brain neuroinflammation. (B) Radar plots representation summarizing the impact of NaCl/placebo, vitamin C or Qiseng® and 5-FU/placebo, vitamin C or Qiseng® treatments on plasma cytokine levels of treated mice. Cytokines in gray indicate no difference between NaCl and 5-FU conditions. Data represent the normalized mean difference between NaCl and 5-FU as percentage. NaCl/placebo (n = 9), 5-FU/placebo (n = 8–9), NaCl/vitamin C (n = 8–9), 5-FU/vitamin C (n = 6–8), NaCl/Qiseng® (n = 10), 5-FU/Qiseng® (n = 8–9). * p < 0.05, ** p < 0.01, *** p < 0.001. (C) Correlation between the different bacteria taxa (except domains) evaluated by qPCR and the different cytokines measured in plasma of NaCl/ and 5-FU/placebo, vitamin C and Qiseng® mice. Beta-, Gamma- and Delta-proteobacteria are the significantly modified group compared with others under Qiseng® treatment. Lactobacillus and some subspecies (L. reuteri, acidophilus and johnsonii/gasseri) corresponded to the taxa found increased after chemotherapy administration. Heatmap of Kendall correlation coefficients from medians: only significant correlations are displayed (adjusted p value < 0.05). The blue color indicates a positive correlation and the red color a negative correlation. The color intensity is proportional to the correlation coefficients. NaCl/placebo (n = 6–9), 5-FU/placebo (n = 8–9), NaCl/vitamin C (n = 8–9), 5-FU/vitamin C (n = 6–8), NaCl/Qiseng® (n = 10), 5-FU/Qiseng® (n = 8–9). 5-FU: 5-fluorouracil, L.: Lactobacillus, GMCSF: Granulocyte Macrophage Colony-Stimulating Factor, IL: Interleukin, MCP-1: Monocyte Chemotactic Protein-1, TNF-α: Tumor Necrosis Factor-α, RANTES: Regulated on Activation Normal T cell Expressed and Secreted.
Figure 8
Figure 8
Effect of 5-FU chemotherapy treatment on brain Il-6 gp130 receptor in dorsal and ventral hippocampus. (A) Schematic timeline for treatments and plasma and brain sampling from the different groups of mice to investigate IL-6-related neuroinflammatory markers. (B) Representative microphotography of the IL-6 receptor gp130 (red) co-stained with the mature neuron NeuN (green) and astrocyte GFAP (yellow) markers in the dHp. The boxed areas show a magnification of gp130/GFAP main co-labelings (white arrows) in the dentate gyrus of the dHp. Scale bar: 100 μm. Bar plots represent mean ± SEM with symbols of individual data points of the effects of 5-FU in the presence of placebo, vitamin C and Qiseng® compared with NaCl on gp130 positive cells in the dHp and vHp compared with their respective controls. Star indicates significant difference within the same groups, and hash indicates significant difference among 5-FU groups (Kruskal–Wallis-Dunn post hoc; * or # p < 0.05, ns: not significant). (C) Correlation between neural stem cell proliferation, gp130 expression in the dHp and vHp, and plasma cytokine levels. Heatmap of Kendall correlation coefficients; only significant correlations found in 5-FU mice are displayed (adjusted p value < 0.05). The blue color indicates a positive correlation and the red color a negative correlation. Color intensity and round size are proportional to the correlation coefficients from 0 to 1/−1. In each analysis, NaCl/placebo (n = 4), 5-FU/placebo (n = 4), NaCl/vitamin C (n = 4), 5-FU/vitamin C (n = 4), NaCl/Qiseng® (n = 4), 5-FU/Qiseng® (n = 4). 5-FU: 5-fluorouracil, BrdU: 5-bromo-2′-deoxyuridine, L.: Lactobacillus, GMCSF: Granulocyte Macrophage Colony-Stimulating Factor, IL: Interleukin, MCP-1: Monocyte Chemotactic Protein-1, TNF-α: Tumor Necrosis Factor-α, RANTES: Regulated on Activation Normal T cell Expressed and Secreted, GFAP: Glial fibrillary acidic protein, gp130: receptor cytokines Glycoprotein 130 kDa, NeuN: Neuronal Nuclei Antigen.

References

    1. Joly F., Heutte N., Duclos B., Noal S., Léger-Hardy I., Dauchy S., Longato N., Desrues L., Houede N., Lange M., et al. Prospective Evaluation of the Impact of Antiangiogenic Treatment on Cognitive Functions in Metastatic Renal Cancer. Eur. Urol. Focus. 2016;2:642–649. doi: 10.1016/j.euf.2016.04.009. - DOI - PubMed
    1. Lange M., Rigal O., Clarisse B., Giffard B., Sevin E., Barillet M., Eustache F., Joly F. Cognitive dysfunctions in elderly cancer patients: A new challenge for oncologists. Cancer Treat. Rev. 2014;40:810–817. doi: 10.1016/j.ctrv.2014.03.003. - DOI - PubMed
    1. Lange M., Joly F., Vardy J., Ahles T., Dubois M., Tron L., Winocur G., De Ruiter M.B., Castel H. Cancer-related cognitive impairment: An update on state of the art, detection, and management strategies in cancer survivors. Ann. Oncol. Off. J. Eur. Soc. Med. Oncol. 2019;30:1925–1940. doi: 10.1093/annonc/mdz410. - DOI - PMC - PubMed
    1. Ferguson R.J., McDonald B.C., Saykin A.J., Ahles T.A. Brain structure and function differences in monozygotic twins: Possible effects of breast cancer chemotherapy. J. Clin. Oncol. Off. J. Am. Soc. Clin. Oncol. 2007;25:3866–3870. doi: 10.1200/JCO.2007.10.8639. - DOI - PMC - PubMed
    1. Silverman D.H.S., Dy C.J., Castellon S.A., Lai J., Pio B.S., Abraham L., Waddell K., Petersen L., Phelps M.E., Ganz P.A. Altered frontocortical, cerebellar, and basal ganglia activity in adjuvant-treated breast cancer survivors 5–10 years after chemotherapy. Breast Cancer Res. Treat. 2007;103:303–311. doi: 10.1007/s10549-006-9380-z. - DOI - PubMed