. 2022 Sep 14;14(18):4455.
doi: 10.3390/cancers14184455.

Thiosemicarbazone Derivatives Developed to Overcome COTI-2 Resistance

Affiliations

Thiosemicarbazone Derivatives Developed to Overcome COTI-2 Resistance

Vivien Pósa et al. Cancers (Basel). .

Abstract

COTI-2 is currently being evaluated in a phase I clinical trial for the treatment of gynecological and other solid cancers. As a thiosemicarbazone, this compound contains an N,N,S-chelating moiety and is, therefore, expected to bind endogenous metal ions. However, besides zinc, the metal interaction properties of COTI-2 have not been investigated in detail so far. This is unexpected, as we have recently shown that COTI-2 forms stable ternary complexes with copper and glutathione, which renders this drug a substrate for the resistance efflux transporter ABCC1. Herein, the complex formation of COTI-2, two novel terminal N-disubstituted derivatives (COTI-NMe2 and COTI-NMeCy), and the non-substituted analogue (COTI-NH2) with iron, copper, and zinc ions was characterized in detail. Furthermore, their activities against drug-resistant cancer cells was investigated in comparison to COTI-2 and Triapine. These data revealed that, besides zinc, also iron and copper ions need to be considered to play a role in the mode of action and resistance development of these thiosemicarbazones. Moreover, we identified COTI-NMe2 as an interesting new drug candidate with improved anticancer activity and resistance profile.

Keywords: COTI-2; anticancer; copper; iron; metal binding; p53; resistance; stability constants; thiosemicarbazones; zinc.


Conflict of interest statement

The authors declare no conflict of interest.

Figures

Scheme 1
Scheme 1
Chemical structures of the clinically investigated TSCs (Triapine, DpC, and COTI-2) as well as COTI-NH2 and the new derivatives, COTI-NMe2 and COTI-NMeCy.
Scheme 2
Scheme 2
Different possible isomers of COTI-NMe2.
Figure 1
Figure 1
(a) UV-vis spectra of COTI-NMeCy recorded at various pH values, and (b) calculated individual molar absorption spectra for the species in the different protonation states. ccompound = 20 µM; pH = 1.5–12.5; T = 25 °C; I = 0.10 M (KCl); = 1.0 cm; and 30% (v/v) DMSO/H2O.
Figure 2
Figure 2
UV-vis spectra of the (a) iron(III)–COTI-2 (1:2) and (b) iron(II)–COTI-NMe2 (1:2) systems recorded at various pH values; (a): cL = 20 µM and cFe(III) = 10 µM; (b): cL = 30 µM, cFe(II) = 15 µM, T = 25 °C, I = 0.10 M (KCl), = 2.0 cm, and 30% (v/v) DMSO/H2O.
Figure 3
Figure 3
Cyclic voltammograms and interaction with glutathione (GSH) of iron(III)–thiosemicarbazone complexes. (a) Normalized cyclic voltammograms of the iron(III)–thiosemicarbazone (1:2) systems at a 0.01 V/s scan rate. cL =1 mM, cFe = 0.5 mM, pH = 7.40 (10 mM HEPES), T = 25 °C, I = 0.1 M (TBAN), and 90% (v/v) DMSO/H2O. (b) Time-dependent changes in the UV-vis absorption spectra of the iron(III)–COTI-NMe2 (1:2) system in the presence of 300 equiv. GSH (solid lines) at pH 7.4 in 5% (v/v) DMSO/H2O under argon and the spectrum of the free ligand (dashed line). cFe(III) = 30 µM, cL = 60 µM, cGSH = 9 mM, T = 25 °C, I = 0.1 M (KCl), and = 1.0 cm.
Figure 4
Figure 4
(a) UV-vis spectra of the copper(II)–COTI-NH2 (1:1) system recorded at various pH values and (b) calculated individual molar absorption spectra; cCu(II) = cL = 80 µM, pH = 1.0–12.5, T = 25 °C, I = 0.10 M (KCl), = 1.0 cm, and 30% (v/v) DMSO/H2O.
Figure 5
Figure 5
Cyclic voltammetry and interaction with GSH for copper(II)–thiosemicarbazone complexes. (a) Normalized cyclic voltammograms of the copper(II)–thiosemicarbazone (1:1) systems at a 0.01 V/s scan rate. cL =1 mM, cCu = 1 mM, pH = 7.40 (10 mM HEPES), T = 25 °C, I = 0.1 M tetrabutylammonium nitrate, and 90% (v/v) DMSO/H2O. (b) Time-dependent changes in the UV-vis absorption spectra of the copper(II)–COTI-NMe2 (1:1) system in the presence of 300 equiv. GSH (solid lines) at pH 7.4 in 5% (v/v) DMSO/H2O under argon and the spectrum of the free ligand (dashed line). cL = cCu(II) = 30 µM, cGSH = 9 mM, T = 25 °C, I = 0.1 M (KCl), and = 1.0 cm.
Figure 6
Figure 6
Calculated concentration distribution curves for (a) Cu(II):COTI-2 = 1:1, (b) Fe(II):COTI-2, (c) Fe(III):COTI-2 = 1:2, and (d) Zn(II):COTI-2 = 1:2 system (cL = cCu(II) = 1 µM, cFe(II) = cFe(II) = cZn(II) = 0.5 µM, 30% (v/v) DMSO/H2O, T = 25 °C, and I = 0.10 M (KCl)). The red lines indicate pH 7.4.
Figure 7
Figure 7
Fold viability plotted against the drug concentration to assay the resistance of SW480/Tria and SW480/Coti cells against COTI-NMeCy, COTI-NMe2, and COTI-2. The anticancer activity of the drugs was tested by MTT viability assay after 72 h of drug incubation in SW480 cells vs. the resistant sublines. The mean ± standard deviation (SD) was derived from triplicates of one representative experiment out of three.
Figure 8
Figure 8
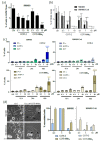
Cell cycle arrest and cell death induction by COTI-2 in SW480 and SW480/Coti cells after 24 h of treatment. (a) The percentage of cells in the G2/M phase was analyzed by staining ethanol-fixed cells with propidium iodide (PI) followed by flow cytometry after 24 h treatment. The mean ± SD was derived from three independent experiments. (b) Nucleic morphology was analyzed by the DAPI staining of methanol/acetone (1:1)-fixed cells after 24 h of treatment. Microscopic images were captured and mitotic cells were counted with ImageJ. The mean ± SD was derived from triplicates of three independent experiments. (c) Cell death induction was analyzed by annexin V (AV) and PI staining followed by flow cytometry. The mean ± SD was derived from three independent experiments after treatment at the indicated time points. (d) Microscopy images of paraptotic vesicle formation (indicated by black arrows) in SW480 and SW480/Coti cells after 24 h of treatment with COTI-2 and COTI-NMe2, and the percentage of vacuolated cells was counted with Image J. The mean ± SD was derived from three independent experiments. Significance was calculated in (a) with one-way ANOVA and the Holm-Sidak’s multiple comparisons test, (b) two-way ANOVA with Sidak’s multiple comparisons test and (c) two-way ANOVA with Dunnett’s multiple comparisons test (p < 0.05 *, p < 0.01 **, p < 0.001 ***, p < 0.0001 ****).
Figure 9
Figure 9
Impact of tetrathiomolybdate (TTM, 1 µM, and 5 µM) on the anticancer activity of COTI-2 and its derivatives in SW480 cells. Viability was measured by MTT assay after 72 h of combined drug treatment. The mean ± SD was derived from triplicates of one representative experiment out of three.
Figure 10
Figure 10
LC-MS measurements of the intracellular levels of free COTI-2 and COTI-NMe2 in SW480 and SW480/Coti cells incubated with a 10 µM drug concentration for 3 h.

References

    1. Yu Y., Gutierrez E., Kovacevic Z., Saletta F., Obeidy P., Suryo Rahmanto Y., Richardson D.R. Iron chelators for the treatment of cancer. Curr. Med. Chem. 2012;19:2689–2702. doi: 10.2174/092986712800609706. - DOI - PubMed
    1. Jung M., Mertens C., Tomat E., Brüne B. Iron as a Central Player and Promising Target in Cancer Progression. Int. J. Mol. Sci. 2019;20:273. doi: 10.3390/ijms20020273. - DOI - PMC - PubMed
    1. Miah A., Harrington K., Nutting C. Triapine in clinical practice. Eur. J. Clin. Med. Oncol. 2010;2:1.
    1. Heffeter P., Pape V.F.S., Enyedy É.A., Keppler B.K., Szakacs G., Kowol C.R. Anticancer Thiosemicarbazones: Chemical Properties, Interaction with Iron Metabolism, and Resistance Development. Antioxid. Redox Signal. 2019;30:1062–1082. doi: 10.1089/ars.2017.7487. - DOI - PubMed
    1. Pelivan K., Frensemeier L., Karst U., Koellensperger G., Bielec B., Hager S., Heffeter P., Keppler B.K., Kowol C.R. Understanding the metabolism of the anticancer drug Triapine: Electrochemical oxidation, microsomal incubation and in vivo analysis using LC-HRMS. Analyst. 2017;142:3165–3176. doi: 10.1039/C7AN00902J. - DOI - PubMed