. 2022 Sep 16;14(18):4488.
doi: 10.3390/cancers14184488.

Direct Comparison of HPV16 Viral Genomic Integration, Copy Loss, and Structural Variants in Oropharyngeal and Uterine Cervical Cancers Reveal Distinct Relationships to E2 Disruption and Somatic Alteration

Affiliations

Direct Comparison of HPV16 Viral Genomic Integration, Copy Loss, and Structural Variants in Oropharyngeal and Uterine Cervical Cancers Reveal Distinct Relationships to E2 Disruption and Somatic Alteration

Travis P Schrank et al. Cancers (Basel). .

Abstract

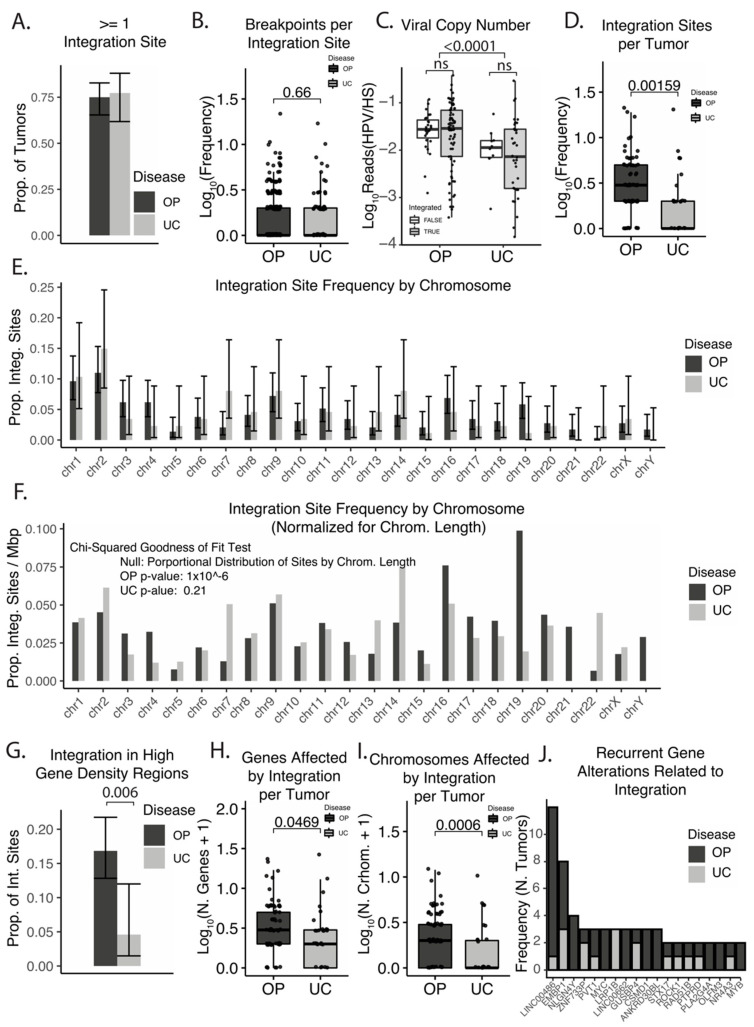
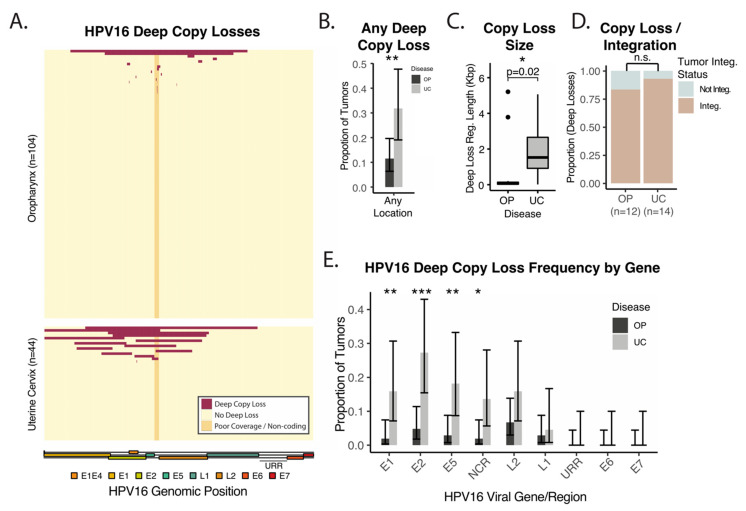
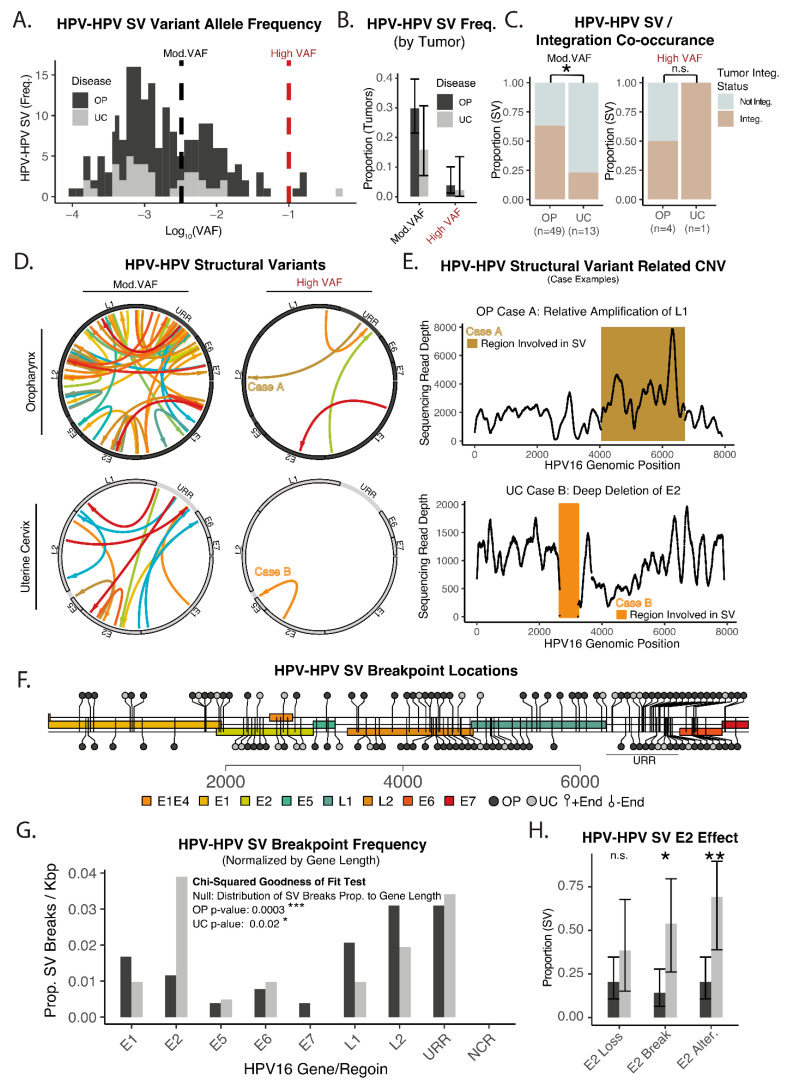
Squamous cell carcinoma of the oropharynx caused by HPV type 16 (HPV16+ OPSCC) is the most common HPV-associated malignancy in the USA and has many molecular differences from uterine cervical squamous cell carcinoma (UCSCC). Our understanding of HPV oncogenesis relied on studies of UCSCC revealing a consensus model reliant on HPV integration with a loss of E2. Here, we compare patterns of HPV integration in UCSCC and OPSCC by analysis of affinity capture sequencing of the HPV16 genome in 104 OPSCC and 44 UCSCC tumors. These cohorts were contemporaneously sequenced using an identical strategy. Integration was identified using discordant read pair clustering and assembly-based approaches. Viral integration sites, structural variants, and copy losses were examined. While large-scale deep losses of HPV16 genes were common in UCSCC and were associated with E2 loss, deep copy losses of the HPV16 genome were infrequent in HPV16+ OPSCC. Similarly, structural variants within HPV16 favored E2 loss in UCSCC but not OPSCC. HPV16 integration sites were non-random, with recurrent integration hot-spots identified. OPSCC tumors had many more integration sites per tumor when compared to UCSCC and had more integration sites in genomic regions with high gene density. These data show that viral integration and E2 disruption are distinct in UCSCC and OPSCC. Our findings also add to growing literature suggesting that HPV tumorigenesis in OPSCC does not follow the model developed based on UCSCC.

Keywords: HPV16; integration; oropharynx; squamous cell carcinoma; uterine cervix.


Conflict of interest statement

The authors declare no conflict of interest.

Figures

Figure 1
Figure 1
Features of HPV16 genomic integration and integration sites in OPSCC and UCSCC. (A) Bar plot—proportion of tumors with detectable integration. Error bars represent 95% confidence intervals. (B) Box plot—number of human–viral breakpoints per integration site. Significance based on Wilcoxon Rank-sum test, p-values are indicated in plot. (C) Box plot—relative viral copy number by disease and integration status. Significance based on Wilcoxon Rank-sum test, p-values are indicated in plot. ns—not significant. (D) Box plot—number of integration sites per tumor. Significance based on Wilcoxon Rank-sum test, p-values are indicated in plot. (E) Bar plot—proportion of integration sites by chromosomal location. Error bars represent 95% confidence intervals. (F) Bar plot—proportion of integration sites by chromosomal location normalized by chromosome length. Significance based on chi-squared goodness of fit test, with sites’ distribution based on chromosome size as a null hypothesis. (G) Bar plot—proportion of integration sites in high gene density regions. High gene density was defined as top 5% of genomic space. Error bars represent 95% confidence intervals. Significance based on chi-squared test, p-value indicated in plot. (H) Box plot—number of genes affected by integration sites per tumor. Genes within 500 kb of the integration site were included. Significance based on Wilcoxon Rank-sum test, p-values are indicated in plot. (I) Box plot—number of chromosomes affected by integration sites per tumor. Significance based on Wilcoxon Rank-sum test, p-values are indicated in plot. (J) Bar plot—frequency of genes effected by integration events. Ordered by decreasing frequency across both OPSCC and UCSCC.
Figure 2
Figure 2
Locations of HPV16 integration sites across the human genome. Genes nearest to the integration sites are indicated. Colors identify tumor samples per chromosome, to allow identification of related sites in single tumors.
Figure 3
Figure 3
Deep losses of HPV16 genomic material in OPSCC and UCSCC. (A) Heatmap—regions of deep loss in the HPV16 genome by tumor. Columns—HPV16 genomic position. Rows—tumors. Dark Red—deep loss. Yellow—no deep loss. Orange—hypervariable non-coding region with poor coverage, excluded from deep loss analysis unless otherwise indicated. (B) Bar plot—proportion of tumors with any deep genomic loss in the HPV16 genome. Error bars represent 95% CI. (C) Boxplot—size distribution of regions of deep copy loss. p-value represents Wilcoxon rank-sum test. (D) Stacked bar plot—proportion of tumors with deep loss and viral integration. (E) Bar plot—proportion of tumors with deep genomic loss affecting the indicated regions of the HPV16 genome. Error bars represent 95% CI. NCR—hypervariable non-coding region with poor coverage (also orange in Panel A). URR—upstream regulatory region. * p-value < 0.05. ** p-value < 0.005. *** p-value < 0.0005.
Figure 4
Figure 4
Structural variants in the HPV16 genome in OPSCC and UCSCC. (A) Histogram—estimated variant allele frequency (VAF) of HPV–HPV structural variants (SVs). High-quality variant calls were investigated based on empiric VAF thresholds indicated. Black dashed line—moderate VAF threshold; variants with VAF greater than this cutoff were analyzed further. Red dashed line—high VAF threshold, variants with VAF greater than this cutoff were independently analyzed and displayed where indicated. (B) Bar plot—proportion of tumors with HPV–HPV SVs. Error bars represent 95% CI. (C) Stacked bar plot—proportion of tumors with HPV–HPV SVs and viral integration. Significance testing represents chi-squared test. * p-value < 0.05. (D) Circos Plots—location and orientation of HPV–HPV SVs. Arrow origin—upstream aspect of structural variant breakpoint junction. Arrow head—downstream aspect of structural variant breakpoint junction. VAF groups are as defined in Panel (A). Colors in each individual plot represent a single tumor sample. (E) Genomic coverage plots—HPV copy number alterations related to HPV–HPV structural variants in tumors with high VAF SVs. The color and case number link coverage plots to the (left) adjacent circus plots in panel (D). (F) Lollipop plot—breakpoint locations of HPV–HPV SVs with moderate VAF. Light grey—HPV–HPV SV from UCSCC tumor. Dark grey—HPV–HPV SV from OPSCC tumor. (G) Bar plot—proportion of HPV–HPV SV breakpoint sites by HPV16 gene or region. Significance based on chi-squared goodness of fit test, with sites distribution based on gene/region size as null hypothesis. * p-value < 0.05. *** p-value < 0.0005. (H) Bar plot—proportion of HPV–HPV SVs and effects on E2. Error bars represent 95% CI. Significance based on chi-squared test. * p-value < 0.05. ** p-value < 0.005.

References

    1. Ibeanu O.A. Molecular Pathogenesis of Cervical Cancer. Cancer Biol. Ther. 2011;11:295–306. doi: 10.4161/cbt.11.3.14686. - DOI - PubMed
    1. Burd E.M. Human Papillomavirus and Cervical Cancer. Clin. Microbiol. Rev. 2003;16:1–17. doi: 10.1128/CMR.16.1.1-17.2003. - DOI - PMC - PubMed
    1. Longworth M.S., Laimins L.A. Pathogenesis of Human Papillomaviruses in Differentiating Epithelia. Microbiol. Mol. Biol. Rev. 2004;68:362–372. doi: 10.1128/MMBR.68.2.362-372.2004. - DOI - PMC - PubMed
    1. McMurray H.R., Nguyen D., Westbrook T.F., McAnce D.J. Biology of Human Papillomaviruses. Int. J. Exp. Pathol. 2001;82:15–33. doi: 10.1046/j.1365-2613.2001.00177.x. - DOI - PMC - PubMed
    1. Schiffman M.H., Bauer H.M., Hoover R.N., Glass A.G., Cadell D.M., Rush B.B., Scott D.R., Sherman M.E., Kurman R.J., Wacholder S. Epidemiologic Evidence Showing That Human Papillomavirus Infection Causes Most Cervical Intraepithelial Neoplasia. J. Natl. Cancer Inst. 1993;85:958–964. doi: 10.1093/jnci/85.12.958. - DOI - PubMed

LinkOut - more resources