. 2022 Aug 28;11(9):1682.
doi: 10.3390/antiox11091682.

Propofol and α2-Agonists Attenuate Microglia Activation and Restore Mitochondrial Function in an In Vitro Model of Microglia Hypoxia/Reoxygenation

Affiliations

Propofol and α2-Agonists Attenuate Microglia Activation and Restore Mitochondrial Function in an In Vitro Model of Microglia Hypoxia/Reoxygenation

Lucia Longhitano et al. Antioxidants (Basel). .

Abstract

Cerebrovascular ischemia is a common clinical disease encompassing a series of complex pathophysiological processes in which oxidative stress plays a major role. The present study aimed to evaluate the effects of Dexmedetomidine, Clonidine, and Propofol in a model of hypoxia/reoxygenation injury. Microglial cells were exposed to 1%hypoxia for 3 h and reoxygenated for 3 h, and oxidative stress was measured by ROS formation and the expression of inflammatory process genes. Mitochondrial dysfunction was assessed by membrane potential maintenance and the levels of various metabolites involved in energetic metabolism. The results showed that Propofol and α2-agonists attenuate the formation of ROS during hypoxia and after reoxygenation. Furthermore, the α2-agonists treatment restored membrane potential to values comparable to the normoxic control and were both more effective than Propofol. At the same time, Propofol, but not α2-agonists, reduces proliferation (Untreated Hypoxia = 1.16 ± 0.2, Untreated 3 h Reoxygenation = 1.28 ± 0.01 vs. Propofol hypoxia = 1.01 ± 0.01 vs. Propofol 3 h Reoxygenation = 1.12 ± 0.03) and microglial migration. Interestingly, all of the treatments reduced inflammatory gene and protein expressions and restored energy metabolism following hypoxia/reoxygenation (ATP content in hypoxia/reoxygenation 3 h: Untreated = 3.11 ± 0.8 vs. Propofol = 7.03 ± 0.4 vs. Dexmedetomidine = 5.44 ± 0.8 vs. Clonidine = 7.70 ± 0.1), showing that the drugs resulted in a different neuroprotective profile. In conclusion, our results may provide clinically relevant insights for neuroprotective strategies in intensive care units.

Keywords: hypoxia; inflammation: mitochondria; microglia; propofol and α2-agonists.


Conflict of interest statement

The authors declare no conflict of interest.

Figures

Figure 1
Figure 1
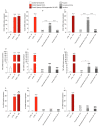
Effect of hypoxia and reoxygenation (A) on ROS production in microglia cells. Effect of Propofol, Dexmedetomidine, and Clonidine on ROS production after 3 h of Hypoxia (B) and 3 h of Reoxygenation (C), analyzed by flow cytometric assay. Data are expressed as mean ± SD of at least four independent experiments. * vs. Untreated Normoxia; (* p < 0.05; ** p < 0.005; *** p < 0.001; **** p < 0.0001); # vs. Untreated Hypoxia; (## p < 0.005; ### p < 0.001; #### p < 0.0001) § vs. Untreated Reoxygenation (§§§§ p < 0.0001) ° vs. the different drugs (propofol vs. dexmedetomidine; propofol vs. clonidine; dexmedetomidine vs. clonidine) (° p < 0.05; °° p < 0.005; °°° p < 0.001; °°°° p < 0.0001). Effect of Hypoxia and Reoxygenation on NLRP3 mRNA expression in (D) Untreated cells, and Propofol, Dexmedetomidine, and Clonidine treated cells (E,F), analyzed by real-time PCR. The calculated value of 2−ΔΔCt in untreated controls is 1. Data are expressed as mean ± SD of at least four independent experiments. * vs. Untreated Normoxia ( ** p < 0.005; *** p < 0.001; **** p < 0.0001); # vs. Untreated Hypoxia (## p < 0.005; ### p < 0.001; #### p < 0.0001); § vs. Untreated Reoxygenation (§§§§ p < 0.0001); ° vs. the different drugs (propofol vs. dexmedetomidine; propofol vs. clonidine; dexmedetomidine vs. clonidine) (° p < 0.05; °°° p < 0.001).
Figure 2
Figure 2
Real-time analysis of ΔΨm modification. JC-1 accumulates in mitochondria as a function of Δψ is excited at 490 nm, and emits at 527 nm when in monomeric form. At high Δψ, JC-1 is concentrated within mitochondria and forms J aggregates, resulting in a shift in emission to 585 nm. Real-time analysis of ΔΨm modification monitoring by Operetta Hugh Content Screening following treatment with (A) Propofol, (B) Dexmedetomidine, and (C) Clonidine. Results are presented as the mean ± SD of four independent experiments.
Figure 3
Figure 3
Real-time cell proliferation monitoring by xCELLigence system following treatments with (A) Propofol, (B) Demedetomidine, and (C) Clonidine, after Hypoxia (3 h) and Reoxygenation. Cell index values were normalized at the time of onset of hypoxia in order to obtain a normalized cell index. The value of normalized cell index of each treatment was normalized in % of normoxic control. Each line is expressing the average of four different experiments. (D) Cell migration analysis following treatments with (E) Propofol, (F) Dexmedetomidinel and (G) Clonidine, analyzed by Operetta High Content Screening. Values are presented as percentage of the open wound following Hypoxia (3 h) and 4, 8, 12, 18, and 24 h of Reoxygenation (wound at time 0 was assumed as 100% and used as control). Values are expressed as the mean ± SD of four different experiments. * vs. Untreated. (* p < 0.05; *** p < 0.001; **** p < 0.0001).
Figure 4
Figure 4
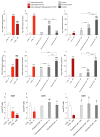
Effect of Hypoxia and Reoxygenation and pharmacological treatments on mRNA expression of COX2 (AC), TNF (DF), IL4 (GI), performed by Real-time PCR. The calculated value of 2ΔΔCt in untreated controls is 1. Data are expressed as mean ± SD of at least four independent experiments. * vs. CTRL Normoxia (* p < 0.05; **** p < 0.0001); # vs. CTRL Hypoxia (## p < 0.005; #### p < 0.0001); § vs. CTRL Hypoxya/reoxygenation (§§§§ p < 0.0001); ° vs. the different drugs (propofol vs. dexmedetomidine; propofol vs. clonidine; dexmedetomidine vs. clonidine) (° p < 0.05; °°°° p < 0.0001).
Figure 5
Figure 5
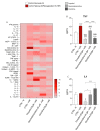
(A) Heatmap representing the levels of major cytokines and chemokines detected Cytokine antibody arrays. (B) TNF, (C) IL4 levels. Results are presented as the mean ± SD of four independent experiments. * vs. CTRL Normoxia (* p < 0.05; **** p < 0.0001); § vs. CTRL Hypoxia/Reoxygenation. (§ p < 0.05; §§§§ p < 0.0001); ° vs. the different drugs (propofol vs. dexmedetomidine; propofol vs. clonidine; dexmedetomidine vs. clonidine) (° p < 0.05; °°° p < 0.001; °°°° p < 0.0001).
Figure 6
Figure 6
Effect of Hypoxia and Reoxygenation and pharmacological treatments on mRNA expression of Arg1 (AC) and NOS2 (DF), performed by Real-time PCR. The calculated value of 2−ΔΔCt in untreated controls is 1. GSH levels detected by HPLC (GI). Data are expressed as mean ± SD of at least four independent experiments. * vs. CTRL Normoxia; (* p < 0.05; ** p < 0.005; *** p < 0.001; **** p < 0.0001); # vs. CTRL Hypoxia; (# p < 0.05; ## p < 0.005; #### p < 0.0001); § vs. CTRL Hypoxya/reoxygenation (§ p < 0.05; §§ p < 0.005; §§§§ p < 0.0001); ° vs. the different drugs (propofol vs. dexmedetomidine; propofol vs. clonidine; dexmedetomidine vs. clonidine) (°°°° p < 0.0001).
Figure 7
Figure 7
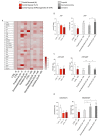
(A) Heatmap representing the levels of major classes of metabolites detected by HPLC. (B) ATP levels; (C) ATP/ADP levels; (D) NAD/NADH levels. Results are presented as the mean ± SD of four independent experiments. * vs. CTRL Normoxia (* p < 0.01; ** p < 0.005; *** p < 0.001); § vs. CTRL Hypoxya/reoxygenation (§ p < 0.05; §§ p < 0.005; §§§ p < 0.001; §§§§ p < 0.0001); ° vs. the different drugs (propofol vs. dexmedetomidine; propofol vs. clonidine; dexmedetomidine vs. clonidine) (° p < 0.05; °° p < 0.005; °°° p < 0.001).

References

    1. Carson M.J., Cameron Thrash J., Walter B. The cellular response in neuroinflammation: The role of leukocytes, microglia and astrocytes in neuronal death and survival. Clin. Neurosci. Res. 2006;6:237–245. doi: 10.1016/j.cnr.2006.09.004. - DOI - PMC - PubMed
    1. Panahi Y., Mojtahedzadeh M., Najafi A., Rajaee S.M., Torkaman M., Sahebkar A. Neuroprotective agents in the intensive care unit. J. Pharmacopunct. 2018;21:226–240. doi: 10.3831/KPI.2018.21.026. - DOI - PMC - PubMed
    1. Drummond J.C., Dao A.V., Roth D.M., Cheng C.R., Atwater B.I., Minokadeh A., Pasco L.C., Patel P.M. Effect of dexmedetomidine on cerebral blood flow velocity, cerebral metabolic rate, and carbon dioxide response in normal humans. Anesthesiology. 2008;108:225–232. doi: 10.1097/01.anes.0000299576.00302.4c. - DOI - PubMed
    1. Mantz J., Dahmani S. Brain Disorders in Critical Illness: Mechanisms, Diagnosis, and Treatment. Cambridge University Press; Cambridge, UK: 2011. Neuromodulatory and neurotoxic effects of sedative agents.
    1. Salomone F., Li Volti G., Vitaglione P., Morisco F., Fogliano V., Zappalà A., Palmigiano A., Garozzo D., Caporaso N., D’Argenio G., et al. Coffee enhances the expression of chaperones and antioxidant proteins in rats with nonalcoholic fatty liver disease. Transl. Res. 2014;163:593–602. doi: 10.1016/j.trsl.2013.12.001. - DOI - PubMed

LinkOut - more resources