. 2022 Aug 31;11(9):1736.
doi: 10.3390/antiox11091736.

Integrin-Linked Kinase Expression in Human Valve Endothelial Cells Plays a Protective Role in Calcific Aortic Valve Disease

Affiliations

Integrin-Linked Kinase Expression in Human Valve Endothelial Cells Plays a Protective Role in Calcific Aortic Valve Disease

Sandra Sánchez-Esteban et al. Antioxidants (Basel). .

Abstract

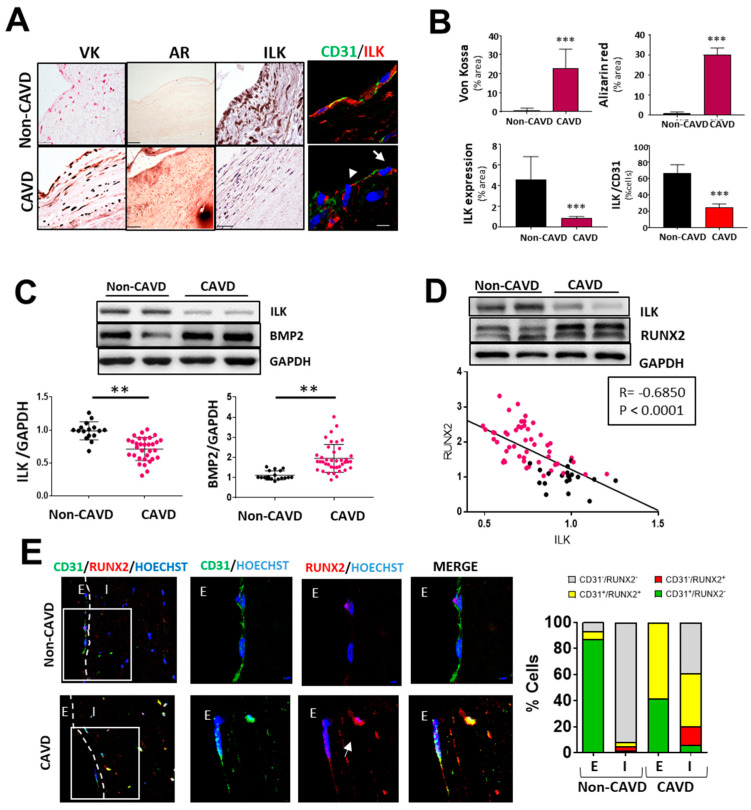
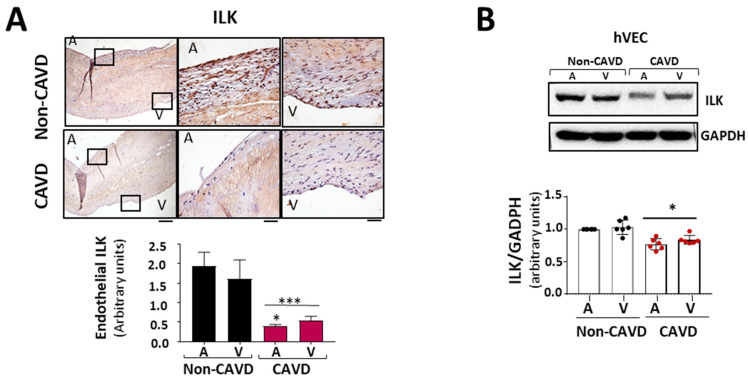
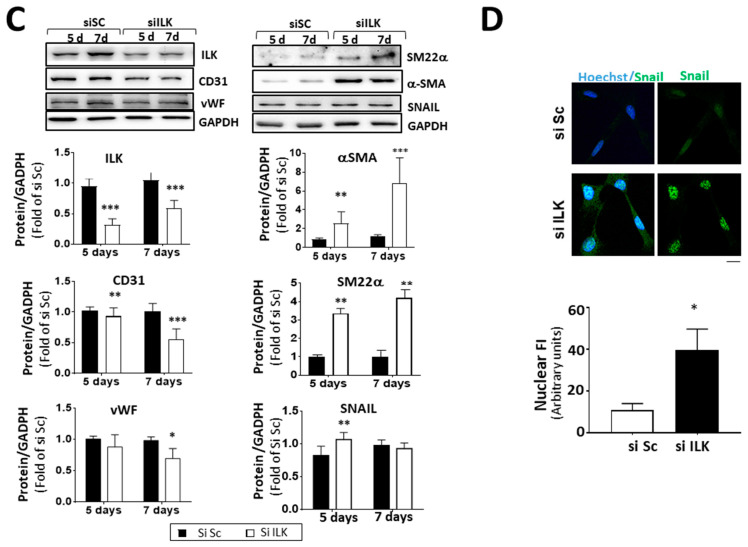
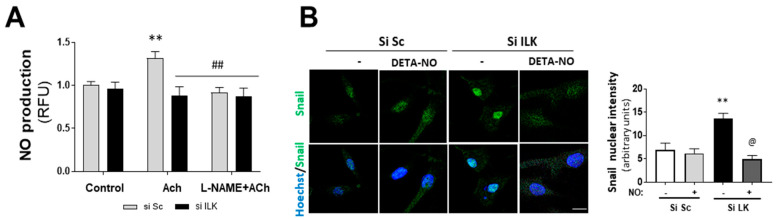
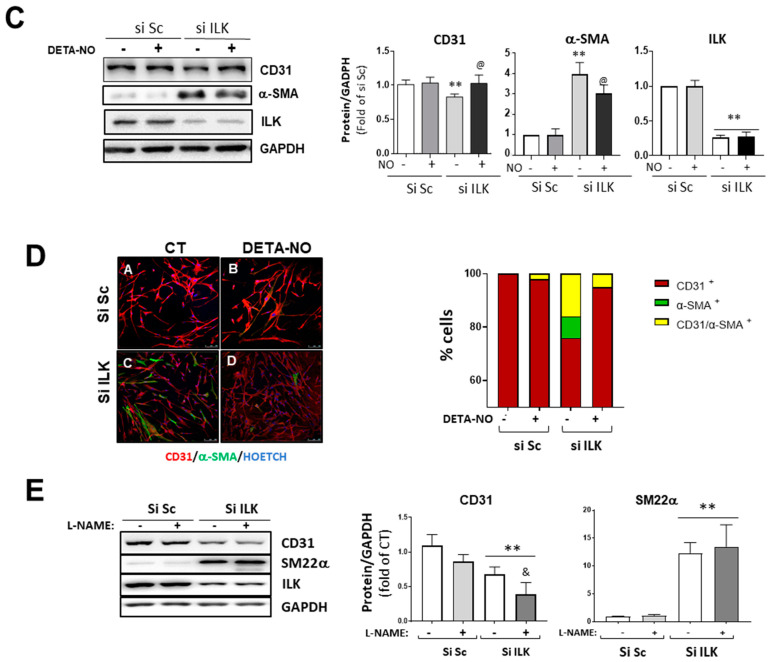
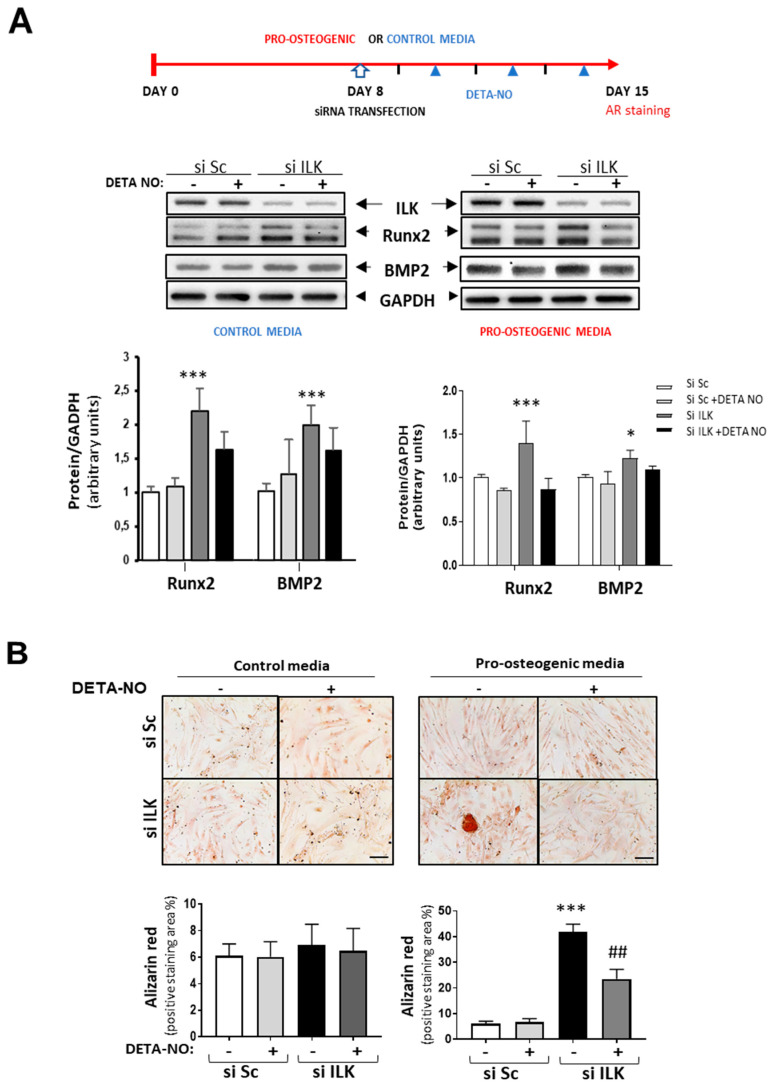
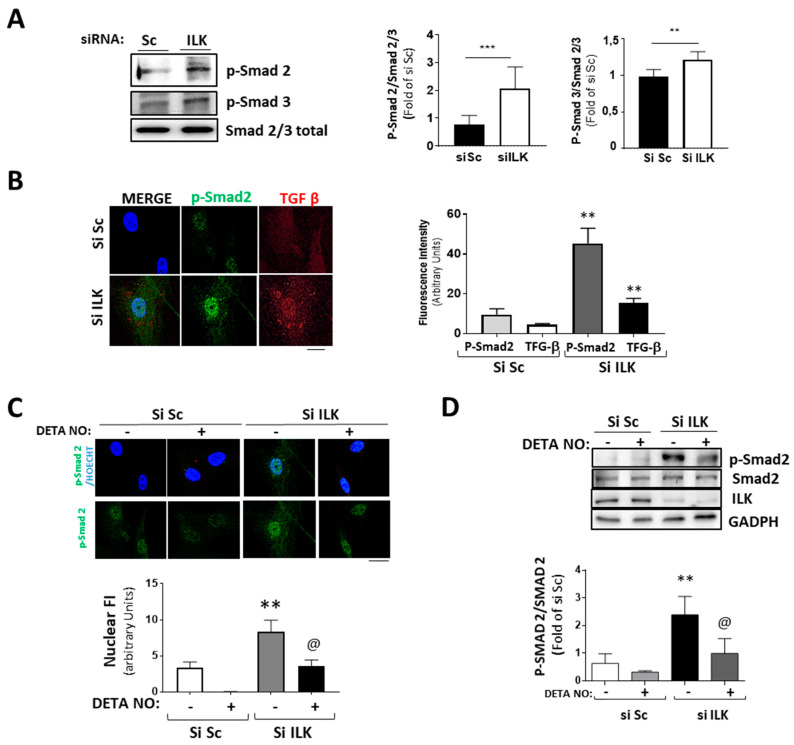
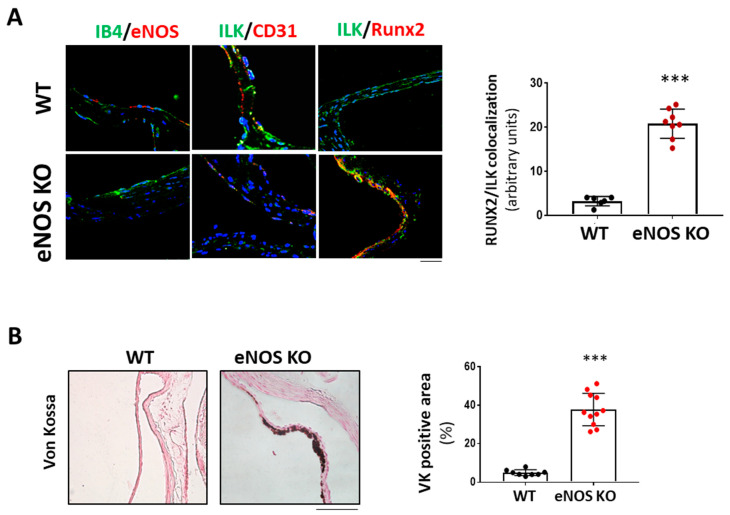
Calcific aortic valve disease (CAVD) is highly prevalent during aging. CAVD initiates with endothelial dysfunction, leading to lipid accumulation, inflammation, and osteogenic transformation. Integrin-linked kinase (ILK) participates in the progression of cardiovascular diseases, such as endothelial dysfunction and atherosclerosis. However, ILK role in CAVD is unknown. First, we determined that ILK expression is downregulated in aortic valves from patients with CAVD compared to non-CAVD, especially at the valve endothelium, and negatively correlated with calcification markers. Silencing ILK expression in human valve endothelial cells (siILK-hVECs) induced endothelial-to-mesenchymal transition (EndMT) and promoted a switch to an osteoblastic phenotype; SiILK-hVECs expressed increased RUNX2 and developed calcified nodules. siILK-hVECs exhibited decreased NO production and increased nitrosative stress, suggesting valvular endothelial dysfunction. NO treatment of siILK-hVECs prevented VEC transdifferentiation, while treatment with an eNOS inhibitor mimicked ILK-silencing induction of EndMT. Accordingly, NO treatment inhibited VEC calcification. Mechanistically, siILK-hVECs showed increased Smad2 phosphorylation, suggesting a TGF-β-dependent mechanism, and NO treatment decreased Smad2 activation and RUNX2. Experiments performed in eNOS KO mice confirmed the involvement of the ILK-eNOS signaling pathway in valve calcification, since aortic valves from these animals showed decreased ILK expression, increased RUNX2, and calcification. Our study demonstrated that ILK endothelial expression participates in human CAVD development by preventing endothelial osteogenic transformation.

Keywords: EndMT; ILK; aging; calcific valve disease; endothelial dysfunction; nitric oxide.


Conflict of interest statement

The authors declare no conflict of interest.

Figures

Figure 1
Figure 1
Endothelial ILK is downregulated in calcific aortic valve disease. (A) Von Kossa (VK) and Alizarin Red (AR) staining of calcium deposits (left panel); immunohistochemistry of ILK (central panel); and immunofluorescence of ILK in red and the endothelial marker CD31 in green (right panel) in non-CAVD or CAVD human aortic valve leaflets. Nuclei were counterstained with Hoechst. Arrows show valve endothelial cells. Scale bar = 25 µm. (B) Quantification of calcification and ILK expression shown in (A). n = 10. *** p < 0.001 vs. non-CAVD. (C,D) Western blot analysis of non-CAVD vs. CAVD valve tissue proteins. (C) ILK and BMP2 expression and quantification (n = 16–31, ** p < 0.01). (D) ILK and RUNX2 expression and Pearson correlation (R = −0.685, *** p < 0.0001, n = 72). (E) Confocal fluorescent microscopy images of CD31 (green) and RUNX2 (red) in non-CAVD and CAVD aortic leaflets. The dotted line delimits the endothelium (E) from the interstitium (I). Cell nuclei were counterstained with Hoechst. On the right, magnifications of areas enclosed in white squares. Scale bar = 25 µm. Arrowheads indicate cells within the valves expressing both markers. Percentages of cells expressing CD31, RUNX2, or both markers are shown on the right. n = 4.
Figure 2
Figure 2
ILK prevents endothelial-to-mesenchymal transition (EndMT) in human valve endothelial cells (hVECs). (A) Immunohistochemistry of ILK in the aortic and ventricular sides of the endothelial layers of non-CAVD or CAVD human aortic valve leaflets. Central and right panels are magnifications of the areas enclosed in squares in the left panels. A = aortic side, V = ventricular side. Scale bar = 100 µm (left panel); 10 μm (central and right panels). Quantification of ILK expression is shown below. n = 6. *** p < 0.001 vs. non-CAVD; * p < 0.01 vs. V side CAVD. (B) Western blot and quantification of ILK protein expression in isolated non-CAVD or CAVD human valve endothelial cells (hVECs). Each point represents ILK expression in VECs isolated from different patients. n = 6. * p < 0.01 vs. non-CAVD. (C) Western blot analysis and quantification of ILK and the EndMT markers CD31, von Willebrand Factor (vWF), alpha-smooth muscle actin (α-SMA), transgelin (SM22α), and Snail in hVECs transfected with siRNA Scramble (si Sc) or siRNA ILK (si ILK) for 5 or 7 days. n = 11, CD31, αSMA, and ILK; n = 6, Snail, SM22α, and vWF. * p < 0.01 vs. Si Sc; ** p < 0.001 vs. Si Sc; *** p < 0.001 vs. Si Sc. (D) Confocal fluorescent microscopy images (left) and quantification of nuclear fluorescence intensity (Nuclear FI) (right) of Snail (green) in transfected hVECs for 5 days. Cell nuclei were counterstained with Hoechst. Scale bar = 10 µm. n = 6. * p < 0.01 vs. Si Sc.
Figure 2
Figure 2
ILK prevents endothelial-to-mesenchymal transition (EndMT) in human valve endothelial cells (hVECs). (A) Immunohistochemistry of ILK in the aortic and ventricular sides of the endothelial layers of non-CAVD or CAVD human aortic valve leaflets. Central and right panels are magnifications of the areas enclosed in squares in the left panels. A = aortic side, V = ventricular side. Scale bar = 100 µm (left panel); 10 μm (central and right panels). Quantification of ILK expression is shown below. n = 6. *** p < 0.001 vs. non-CAVD; * p < 0.01 vs. V side CAVD. (B) Western blot and quantification of ILK protein expression in isolated non-CAVD or CAVD human valve endothelial cells (hVECs). Each point represents ILK expression in VECs isolated from different patients. n = 6. * p < 0.01 vs. non-CAVD. (C) Western blot analysis and quantification of ILK and the EndMT markers CD31, von Willebrand Factor (vWF), alpha-smooth muscle actin (α-SMA), transgelin (SM22α), and Snail in hVECs transfected with siRNA Scramble (si Sc) or siRNA ILK (si ILK) for 5 or 7 days. n = 11, CD31, αSMA, and ILK; n = 6, Snail, SM22α, and vWF. * p < 0.01 vs. Si Sc; ** p < 0.001 vs. Si Sc; *** p < 0.001 vs. Si Sc. (D) Confocal fluorescent microscopy images (left) and quantification of nuclear fluorescence intensity (Nuclear FI) (right) of Snail (green) in transfected hVECs for 5 days. Cell nuclei were counterstained with Hoechst. Scale bar = 10 µm. n = 6. * p < 0.01 vs. Si Sc.
Figure 3
Figure 3
Nitric oxide prevents EndMT in hVECs. (A) Flow cytometry analysis of NO production in hVECs transfected with siSc or silk for 3 days. Cells were pre-treated with saline buffer (Control), Acetylcholine (ACh), L-NAME, or a combination thereof, according to the experimental procedure. n = 6. ** p < 0.001 vs. control; ## p < 0.001 vs. Si Sc treated with Ach. (B) Confocal fluorescent microscopy images of SNAIL in transfected hVECs treated with the NO donor DETA-NONOate (DETA-NO) for 5 days (left). Nuclei were counterstained with Hoechst. Nuclear intensity quantification is represented on the right. Scale bar = 10 μm. n = 6. ** p < 0.001 vs. Si Sc; @ p < 0.001 vs. Si ILK without NO. (C) Western blot analysis (left) and quantification (right) of ILK, CD31, and alpha-smooth muscle actin (α-SMA) in transfected hVECs and treated with the NO donor DETA-NONOate (DETA-NO) for 5 days. n = 6. ** p < 0.001 vs. Si Sc; @ p < 0.001 vs. Si ILK without NO. (D) Double immunofluorescence of CD31 (red) and α-SMA (green) of hVECs in the same conditions as those in (A). Cell nuclei were counterstained with Hoechst. n = 10. Scale bar = 100 µm. (E) Western blot analysis (left) and quantification (right) of CD31 and alpha-smooth muscle actin (α-SMA) in transfected hVECs treated with the NOS inhibitor L-NAME for 5 days. n = 6. ** p < 0.001 vs. Si Sc; & p < 0.001 vs. Si ILK without L-NAME.
Figure 3
Figure 3
Nitric oxide prevents EndMT in hVECs. (A) Flow cytometry analysis of NO production in hVECs transfected with siSc or silk for 3 days. Cells were pre-treated with saline buffer (Control), Acetylcholine (ACh), L-NAME, or a combination thereof, according to the experimental procedure. n = 6. ** p < 0.001 vs. control; ## p < 0.001 vs. Si Sc treated with Ach. (B) Confocal fluorescent microscopy images of SNAIL in transfected hVECs treated with the NO donor DETA-NONOate (DETA-NO) for 5 days (left). Nuclei were counterstained with Hoechst. Nuclear intensity quantification is represented on the right. Scale bar = 10 μm. n = 6. ** p < 0.001 vs. Si Sc; @ p < 0.001 vs. Si ILK without NO. (C) Western blot analysis (left) and quantification (right) of ILK, CD31, and alpha-smooth muscle actin (α-SMA) in transfected hVECs and treated with the NO donor DETA-NONOate (DETA-NO) for 5 days. n = 6. ** p < 0.001 vs. Si Sc; @ p < 0.001 vs. Si ILK without NO. (D) Double immunofluorescence of CD31 (red) and α-SMA (green) of hVECs in the same conditions as those in (A). Cell nuclei were counterstained with Hoechst. n = 10. Scale bar = 100 µm. (E) Western blot analysis (left) and quantification (right) of CD31 and alpha-smooth muscle actin (α-SMA) in transfected hVECs treated with the NOS inhibitor L-NAME for 5 days. n = 6. ** p < 0.001 vs. Si Sc; & p < 0.001 vs. Si ILK without L-NAME.
Figure 4
Figure 4
NO reverses the osteogenic phenotype induced by ILK silencing in hVECs. (A) Top: Scheme of the experimental design. Below: Western blot analysis (left) and quantification (right) of RUNX2 and BMP2. n = 8. * p < 0.05; *** p < 0.0001. (B) Alizarin Red staining. hVECs cultured with control medium or pro-osteogenic medium for 15 days were transfected with siSc or siILK for the last 7 days and treated with DETA-NO for 7 days. DETA-NO treatment was replenished every other day. Scale bar = 100 μm. Below: Quantification of alizarin red positive area. n = 6. Pro-calcific medium: *** p < 0.0001 vs. Si Sc; ## p < 0.001 vs. Si ILK.
Figure 5
Figure 5
Silencing of ILK in hVECs induced EnMT through the TGF/SMAD2/3 axis in a nitric-oxide-dependent manner. (A,B) hVECs transfected with siSc or siILK for 5 days. (A) Western blot analysis and quantification of phospho-Smad2 and phospho-Smad3. *** p < 0.0001 vs. Si Sc; ** p < 0.001 vs. Si Sc (B) Immunofluorescence of phospho-Smad2 (green) and TGF-β (red) and quantification of fluorescence intensity (right). n = 6. ** p < 0.001 vs. Si Sc. (C,D) hVECs transfected with siSc or siILK and treated with DETA-NONOate for 5 days. Quantification of nuclear translocation (right). n = 6. ** p < 0.001 vs. Si Sc. (C) Confocal fluorescent microscopy images of phospho-Smad2. (D) Western blot analysis of phospho-Smad2 and quantification. n = 6. ** p < 0.001 vs. Si Sc; @ p < 0.001 vs. Si ILK.
Figure 6
Figure 6
eNOS knock-out mice exhibited valve calcification, which correlates with low levels of ILK expression and increased RunX2 in valve endothelium. (A) Confocal microscopy image of endothelial marker IB4 in green and eNOS in red (left panel); ILK in green and endothelial marker CD31 in red (central panel); and ILK in green and Runx2 in red (right panel) in eNOS KO mice vs. WT. On the left, quantitation of ILK/RUNX2 colocalization in valve endothelium. N = 8. *** p < 0.0001 vs. WT. (B) Von Kossa staining in aortic valves of WT and eNOS KO mice. Scale bar = 50 μm. A quantification of VK positive area with respect to total area is shown below. n = 11. *** p < 0.0001 vs. WT.

References

    1. Rutkovskiy A., Malashicheva A., Sullivan G., Bogdanova M., Kostareva A., Stensløkken K.O., Fiane A., Vaage J. Valve Interstitial Cells: The Key to Understanding the Pathophysiology of Heart Valve Calcification. J. Am. Heart Assoc. 2017;6 doi: 10.1161/JAHA.117.006339. - DOI - PMC - PubMed
    1. Yadgir S., Johnson C.O., Aboyans V., Adebayo O.M., Adedoyin R.A., Afarideh M., Alahdab F., Alashi A., Alipour V., Arabloo J., et al. Global, Regional, and National Burden of Calcific Aortic Valve and Degenerative Mitral Valve Diseases, 1990–2017. Circulation. 2020;141:1670–1680. doi: 10.1161/CIRCULATIONAHA.119.043391. - DOI - PubMed
    1. Goody P.R., Hosen M.R., Christmann D., Niepmann S.T., Zietzer A., Adam M., Bönner F., Zimmer S., Nickenig G., Jansen F. Aortic Valve Stenosis: From Basic Mechanisms to Novel Therapeutic Targets. Arterioscler. Thromb. Vasc. Biol. 2020;40:885–900. doi: 10.1161/ATVBAHA.119.313067. - DOI - PubMed
    1. Lindman B.R., Sukul D., Dweck M.R., Madhavan M.V., Arsenault B.J., Coylewright M., Merryman W.D., Newby D.E., Lewis J., Harrell F.E., et al. Evaluating Medical Therapy for Calcific Aortic Stenosis: JACC State-of-the-Art Review. J. Am. Coll. Cardiol. 2021;78:2354–2376. doi: 10.1016/j.jacc.2021.09.1367. - DOI - PMC - PubMed
    1. Ma X., Zhao D., Yuan P., Li J., Yun Y., Cui Y., Zhang T., Ma J., Sun L., Ma H., et al. Endothelial-to-Mesenchymal Transition in Calcific Aortic Valve Disease. Acta Cardiol. Sin. 2020;36:183–194. doi: 10.6515/ACS.202005_36(3).20200213A. - DOI - PMC - PubMed