. 2022 Sep 18;11(9):1833.
doi: 10.3390/antiox11091833.

New Properties of a Well-Known Antioxidant: Pleiotropic Effects of Human Lactoferrin in Mice Exposed to Gamma Irradiation in a Sublethal Dose

Affiliations

New Properties of a Well-Known Antioxidant: Pleiotropic Effects of Human Lactoferrin in Mice Exposed to Gamma Irradiation in a Sublethal Dose

Marina Yu Kopaeva et al. Antioxidants (Basel). .

Abstract

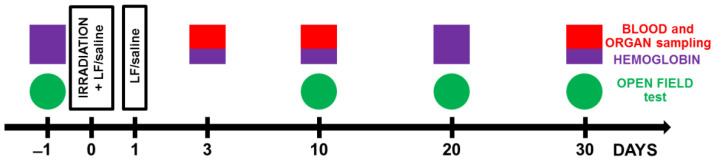
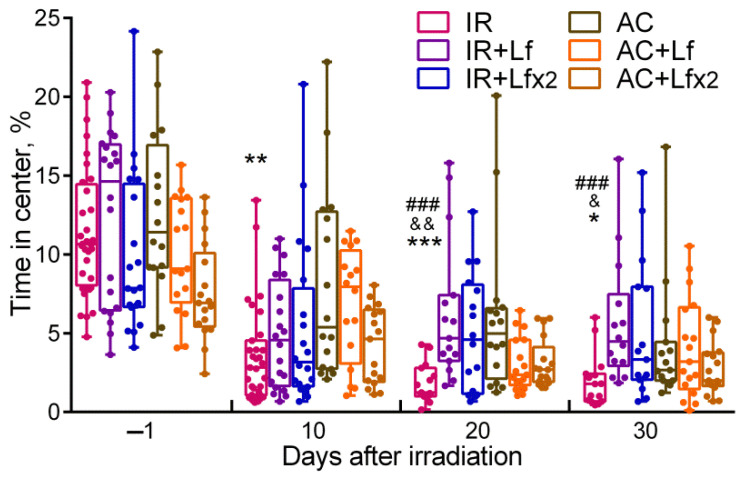
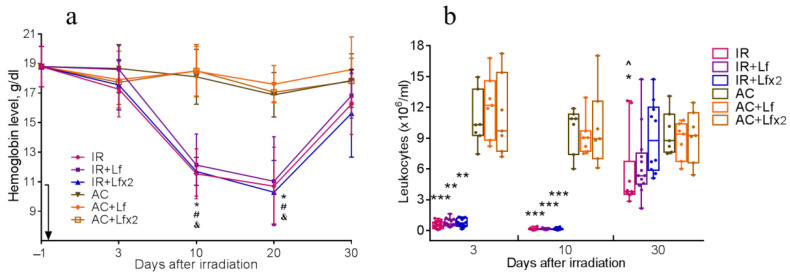
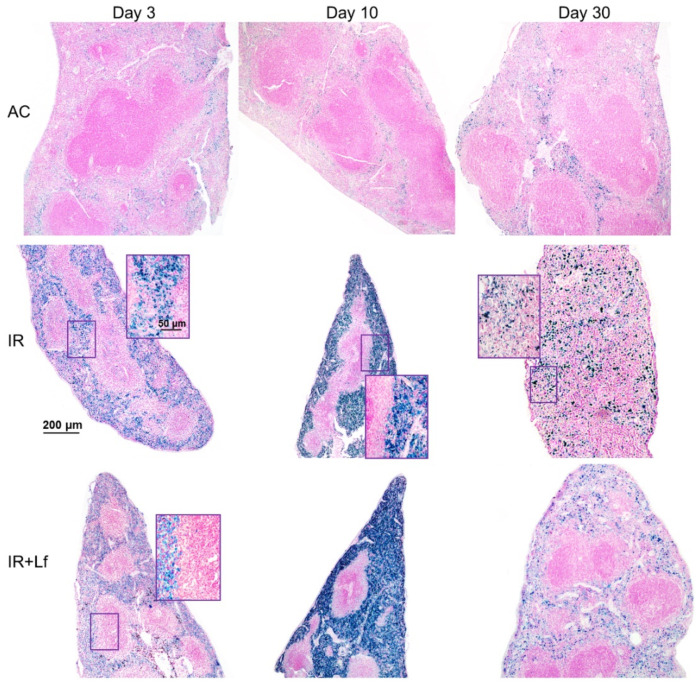
We studied the effects of human lactoferrin (hLf), a multifunctional protein from the transferrin family, on integral (survival, lifespan during the experiment, body weight, behavior, subfractional compositions of blood serum) and systemic (hemoglobin level, leukocyte number, differential leukocyte count, histological structure of the liver and spleen) parameters of the body in mice after acute gamma irradiation in a sublethal dose. The experiments were performed on male C57BL/6 mice. The mice in the experimental groups were exposed to whole-body gamma radiation in a dose of 7.5 Gy from a 60Co source. Immediately after irradiation and 24 h after it, some animals received an intraperitoneal injection of hLf (4 mg/mouse). Single or repeated administration of hLf had a positive pleiotropic effect on irradiated animals: animal survival increased from 28% to 78%, and the mean life expectancy during the experiment (30 days) increased from 16 to 26 days. A compensatory effect of hLf on radiation-induced body weight loss, changes in homeostasis parameters, and a protective effect on the structural organization of the spleen were demonstrated. These data indicate that Lf has potential as a means of early therapy after radiation exposure.

Keywords: C57Bl/6 mice; acute gamma irradiation; human lactoferrin; leukocytes; open field test; serum homeostasis; spleen; survival rate.


Conflict of interest statement

The authors declare no conflict of interest.

Figures

Figure 1
Figure 1
Experimental timeline. Animals from experimental groups were exposed to 7.5 Gy whole-body gamma irradiation. Some animals received intraperitoneal injections of Lf (4 mg/mouse) immediately and 24 h after irradiation. The open field test (OF) was performed prior to irradiation and on days 10, 20, and 30 after it. On days 3, 10, and 30 after irradiation, organs (liver, spleen) and whole blood were taken for analysis. The hemoglobin level and the number of leukocytes in the peripheral blood of animals were determined.
Figure 2
Figure 2
Effects of Lf on the survival rate (a) and lifespan (b) of mice after 7.5 Gy whole-body gamma irradiation. Lf (i.p.; 4 mg/mouse) was administered immediately after irradiation (IR+Lf and IR+Lf×2) and 24 h after it (IR+Lf×2). n = 32 in each group. The survival rates (%) and lifespan (days) during the 30-day period after irradiation are presented. **** p < 0.0001 in comparison with the IR group.
Figure 3
Figure 3
Effect of Lf on the body weight of mice after 7.5 Gy whole-body gamma irradiation. The arrow shows the day of irradiation. Lf (i.p.; 4 mg/mouse) was administered immediately after irradiation/sham-irradiation (IR+Lf, IR+Lf×2, AC+Lf, AC+Lf×2) and 24 h after it (IR+Lf×2, AC+Lf×2). n = 32 (for IR, IR+Lf, and IR+Lf×2); n = 17 (for AC, AC+Lf, and AC+Lf×2); n = 10 (PC). Values are presented as mean ± SEM. * p < 0.05—IR vs. AC; # p < 0.05—IR+Lf vs. AC+Lf; & p < 0.05—IR+Lf×2 vs. AC+Lf×2; + p < 0.05, ++ p < 0.01—IR vs. IR+Lf; ^ p < 0.05, ^^ p < 0.01—IR vs. IR+Lf×2 on the same day.
Figure 4
Figure 4
Effects of Lf on mouse behavior in the open field test after 7.5 Gy whole-body gamma irradiation. Lf (i.p.; 4 mg/mouse) was administered immediately after irradiation/sham-irradiation (IR+Lf, IR+Lf×2, AC+Lf, AC+Lf×2) and 24 h after it (IR+Lf×2, AC+Lf×2). Total distance traveled (a). Number of rearings (b). n = 32, 20, 20 (day −1; for IR, IR+Lf, and IR+Lf×2, respectively); n = 17 (for AC, AC+Lf, and AC+Lf×2). Values are presented as mean ± SEM. ** p < 0.01, *** p < 0.001, **** p < 0.0001 in comparison with the corresponding control (sham-irradiated) groups on the same day; # p < 0.05 in comparison with the IR+Lf group, & p < 0.05 in comparison with the IR+Lf×2 group on day 20. ^ p < 0.05; + p < 0.05.
Figure 5
Figure 5
Effect of Lf on mouse behavior in the open field test after 7.5 Gy whole-body gamma irradiation. Lf (i.p.; 4 mg/mouse) was administered immediately after irradiation/sham-irradiation (IR+Lf, IR+Lf×2, AC+Lf, AC+Lf×2) and 24 h after it (IR+Lf×2, AC+Lf×2). Percent time spent in the center. Each dot represents a single animal. n = 32, 20, 20 (day −1; for IR, IR+Lf, and IR+Lf×2, respectively); n = 17 (for AC, AC+Lf, and AC+Lf×2). Data are presented as the median, quartiles, and min–max range. * p < 0.05, ** p < 0.01, *** p < 0.001 in comparison with the AC group; ### p < 0.001 in comparison with the IR+Lf group; & p < 0.05; && p < 0.01 in comparison with the IR+Lf×2 group on the same day.
Figure 6
Figure 6
Dynamics of changes in the hemoglobin level (a) and the number of leukocytes (b) in the peripheral blood of mice after 7.5 Gy whole-body gamma irradiation. The arrow shows the day of irradiation. Lf (i.p.; 4 mg/mouse) was administered immediately after irradiation/sham-irradiation (IR+Lf, IR+Lf×2, AC+Lf, AC+Lf×2) and 24 h after it (IR+Lf×2, AC+Lf×2). (a) n = 21, 15, 15 (day −1; for IR, IR+Lf, and IR+Lf×2, respectively); n = 9 (for AC, AC+Lf, and AC+Lf×2). * p < 0.05—IR vs. AC; # p < 0.05—IR+Lf vs. AC+Lf; & p < 0.05—IR+Lf×2 vs. AC+Lf×2 on the same day. (b) Each dot represents a single animal. n = 20, 15, 12 (day −1; for IR, IR+Lf, and IR+Lf×2, respectively); n = 7 (for AC, AC+Lf, and AC+Lf×2). * p < 0.05, ** p < 0.01, *** p < 0.001 in comparison with the corresponding control (sham-irradiated) groups on the same day; ^ p < 0.05 in comparison with group IR+Lf×2 on day 30.
Figure 7
Figure 7
Effects of Lf on differential leukocyte count in the mice on days 3 (left) and 30 (right) after 7.5 Gy whole-body gamma irradiation. The relative content of blood cells (%). n = 5–6 (day 3), n = 7 (day 30) for each group. Data are presented as median ± interquartile range. * p < 0.05, ** p < 0.01, *** p < 0.001; # p < 0.05 in comparison with the IR+Lf group; & p < 0.05 in comparison with the IR+Lf×2 group.
Figure 8
Figure 8
Changes in the DLS spectra of the blood serum from mice in the control groups on days 3 and 30 after sham-irradiation. n = 5–6 (day 3), n = 12–14 (day 30) for each group. Particle size distribution (a). # p < 0.05—AC+Lf vs. AC, & p < 0.05—AC+Lf×2 vs. AC, + p < 0.05—AC+Lf vs. AC+Lf×2. Particle distribution by spectral zones (b). # p < 0.05, ## p < 0.01, ### p < 0.001, & p < 0.05, && p < 0.01 in comparison with the same group on day 30; @ p < 0.05, @@ p < 0.01 in comparison with the AC group on day 3; $$ p < 0.01 in comparison with the AC+Lf×2 group on day 3.
Figure 9
Figure 9
Changes in the DLS spectra of mouse blood serum on day 3 after 7.5 Gy whole-body gamma irradiation. Particle size distribution (a). Particles distribution by spectral zones (b). n = 5–6 for each group. * p < 0.05, ** p < 0.01—IR vs. AC, # p < 0.05, ### p < 0.001—IR+Lf vs. AC+Lf, & p < 0.05, &&& p < 0.001—IR+Lf×2 vs. AC+Lf×2, + p < 0.05—IR vs. IR+Lf, ^ p < 0.05, ^^^ p < 0.001—IR vs. IR+Lf×2, @ p < 0.05, @@ p < 0.01 in comparison with the AC group; $$ p < 0.01 in comparison with the AC+Lf×2 group.
Figure 10
Figure 10
Effect of Lf on the changes in the DLS spectra of mouse blood serum on day 30 after 7.5 Gy gamma irradiation. Lf (i.p.; 4 mg/mouse) was administered immediately after irradiation/sham-irradiation (IR+Lf, IR+Lf×2, AC+Lf, AC+Lf×2) and 24 h after it (IR+Lf×2, AC+Lf×2). Particle size distribution (a). Particles distribution by spectral zones (b). n = 9–15 for each group. * p < 0.05—IR vs. AC, # p < 0.05—IR+Lf vs. AC+Lf, & p < 0.05—IR+Lf×2 vs. AC+Lf×2, + p < 0.05—IR vs. IR+Lf, ^ p < 0.05—IR vs. IR+Lf×2.
Figure 11
Figure 11
Protective effect of Lf on the structural organization of the spleen in the irradiated mice. Representative photomicrographs of spleen sections on days 3 (left column; n = 5–6 for each group), 10 (middle column; n = 5–6 for each group), and 30 (right column; n = 7–10 for each group) days after 7.5 Gy whole-body gamma irradiation. Groups: AC (sham-irradiated), IR (irradiated), IR+Lf (Lf was administered immediately after irradiation; i.p.; 4 mg/mouse). Pearl’s staining for iron (III). Scale bars = 200 μm and 50 μm.
Figure 12
Figure 12
Protective effect of Lf on the structural organization of the spleen in the irradiated mice. Representative photomicrographs of spleen sections on day 30 after 7.5 Gy whole-body gamma irradiation. Groups: AC (sham-irradiated), IR (irradiated), IR+Lf (Lf was administered immediately after irradiation; i.p.; 4 mg/mouse), IR+Lf×2 (Lf was administered twice: immediately after irradiation and 24 h after it). Megakaryocytes (arrows). van Gieson staining. Scale bars = 200 μm and 50 μm.
Figure 13
Figure 13
Solitary clusters of mononuclear cells in the liver parenchyma of control mice. Representative photomicrographs of liver sections on days 3 (left) and 30 (middle; right) after sham-irradiation. Groups: AC, AC+Lf, AC+Lf×2. Hematoxylin and Eosin staining. Scale bar = 50 μm.
Figure 14
Figure 14
The histological changes in mouse liver after 7.5 Gy whole-body gamma irradiation: necrosis ((a,b), asterisks), pyknotic nuclei ((a), arrows), numerous mitoses ((a,c), arrow heads), vacuolar dystrophy of hepatocytes (c), mononuclear infiltration (d). Megakaryocyte (b). Representative photomicrographs of liver sections (groups: IR, IR+Lf, IR+Lf×2). Hematoxylin and Eosin staining. Scale bars = 50 μm and 20 μm.
Figure 15
Figure 15
Lf promoted recovery of mononuclear cell clusters in the liver parenchyma of mice exposed to 7.5 Gy whole-body gamma irradiation. Representative photomicrographs of liver sections on days 10 (upper; n = 5–6 for each group) and 30 (bottom; n = 7–10 for each group) after irradiation. Groups: IR (irradiated), IR+Lf (Lf was administered immediately after irradiation; i.p.; 4 mg/mouse), IR+Lf×2 (Lf was administered twice: immediately after irradiation and 24 h after it). van Gieson staining. Scale bar = 20 μm.

References

    1. Seed T.M. Radiation protectants: Current status and future prospects. Health Phys. 2005;89:531–545. doi: 10.1097/01.HP.0000175153.19745.25. - DOI - PubMed
    1. Reisz J.A., Bansal N., Qian J., Zhao W., Furdui C.M. Effects of Ionizing Radiation on Biological Molecules—Mechanisms of Damage and Emerging Methods of Detection. Antioxid. Redox Signal. 2014;21:260–292. doi: 10.1089/ars.2013.5489. - DOI - PMC - PubMed
    1. Weiss J.F., Landauer M.R. Radioprotection by Antioxidantsa. Ann. N. Y. Acad. Sci. 2006;899:44–60. doi: 10.1111/j.1749-6632.2000.tb06175.x. - DOI - PubMed
    1. Nishimura Y., Homma-Takeda S., Kim H.-S., Kakuta I. Radioprotection of Mice by Lactoferrin against Irradiation with Sublethal X-rays. J. Radiat. Res. 2014;55:277–282. doi: 10.1093/jrr/rrt117. - DOI - PMC - PubMed
    1. Ogasawara Y., Imase M., Oda H., Wakabayashi H., Ishii K. Lactoferrin Directly Scavenges Hydroxyl Radicals and Undergoes Oxidative Self-Degradation: A Possible Role in Protection against Oxidative DNA Damage. Int. J. Mol. Sci. 2014;15:1003–1013. doi: 10.3390/ijms15011003. - DOI - PMC - PubMed

LinkOut - more resources