Published Erratum
. 2022 Aug 30;11(9):1169.
doi: 10.3390/antibiotics11091169.

Correction: Papp, M.; Solymosi, N. Review and Comparison of Antimicrobial Resistance Gene Databases. Antibiotics 2022, 11, 339

Affiliations
Published Erratum

Correction: Papp, M.; Solymosi, N. Review and Comparison of Antimicrobial Resistance Gene Databases. Antibiotics 2022, 11, 339

Márton Papp et al. Antibiotics (Basel). .

Abstract

While preparing our next manuscript, we noticed a few errors in our published paper [...].


Figures

Figure 1
Figure 1
ARG and sequence content of the databases. Only antibiotic and biocide resistance genes were considered for the plot. For each database on the x axis, the number of unique sequences and the corresponding number of unique genes were determined. The y axis represents the number of genes and sequences. Red bars show the gene number while blue bars represent the number of sequences stored in each database.
Figure 2
Figure 2
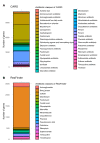
Number of unique genes for each antibiotic class stored in CARD and ResFinder. Bars represent the number of genes in each unique antibiotic or biocide categories, where colors are associated with the specific antibiotics themselves. As one gene can confer resistance to multiple antibiotics, it is possible that the same gene is counted for two or more antibiotics. The plots show the data for CARD (A) and ResFinder (B), respectively.
Figure 3
Figure 3
Number of genes conferring resistance through mutations for each microbial genus in CARD, NDARO and MEGARes databases. Genes conferring resistance through mutations was calculated at the genus level for each microbe stored in each database. Only one group could not be summarized at the genus level (propionibacteria). Microbial genus is on the x axis and the number of genes associated with each group in the database is represented by the y axis. Rows show the data separately for each database. Columns are colored by the microbial genus.
Figure S2
Figure S2
NDARO gene counts of each antibiotic class. Number of resistance genes were determined for each class of antibiotics stored in the NDARO database. Only antibiotic- and biocid resistance genes were considered for this plot.

Erratum for

References

    1. Papp M., Solymosi N. Review and Comparison of Antimicrobial Resistance Gene Databases. Antibiotics. 2022;11(Pt 2):33. doi: 10.3390/antibiotics11030339. - DOI - PMC - PubMed

Publication types

LinkOut - more resources