. 2022 Aug 25;10(9):2077.
doi: 10.3390/biomedicines10092077.

Adipocyte-Specific Laminin Alpha 4 Deletion Preserves Adipose Tissue Health despite Increasing Adiposity

Affiliations

Adipocyte-Specific Laminin Alpha 4 Deletion Preserves Adipose Tissue Health despite Increasing Adiposity

Jennifer L Bailey et al. Biomedicines. .

Abstract

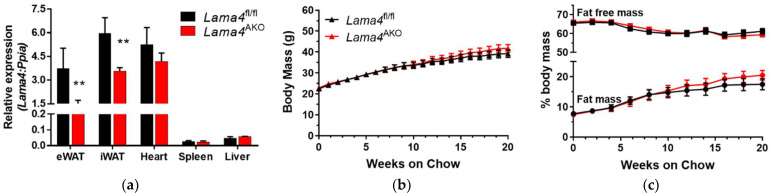
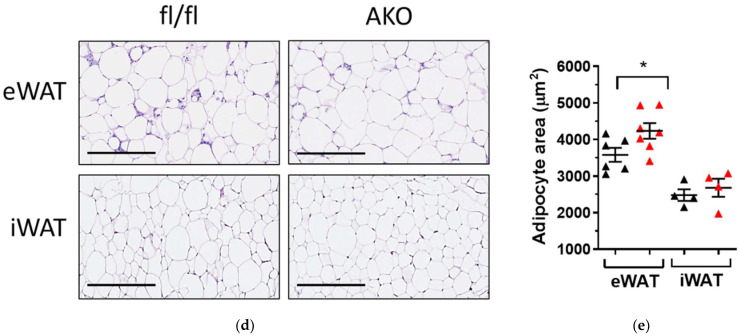
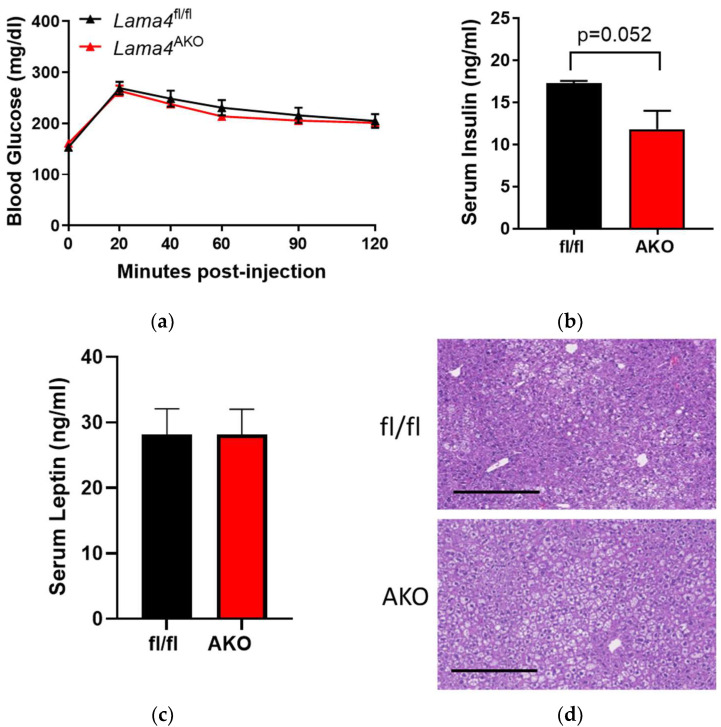
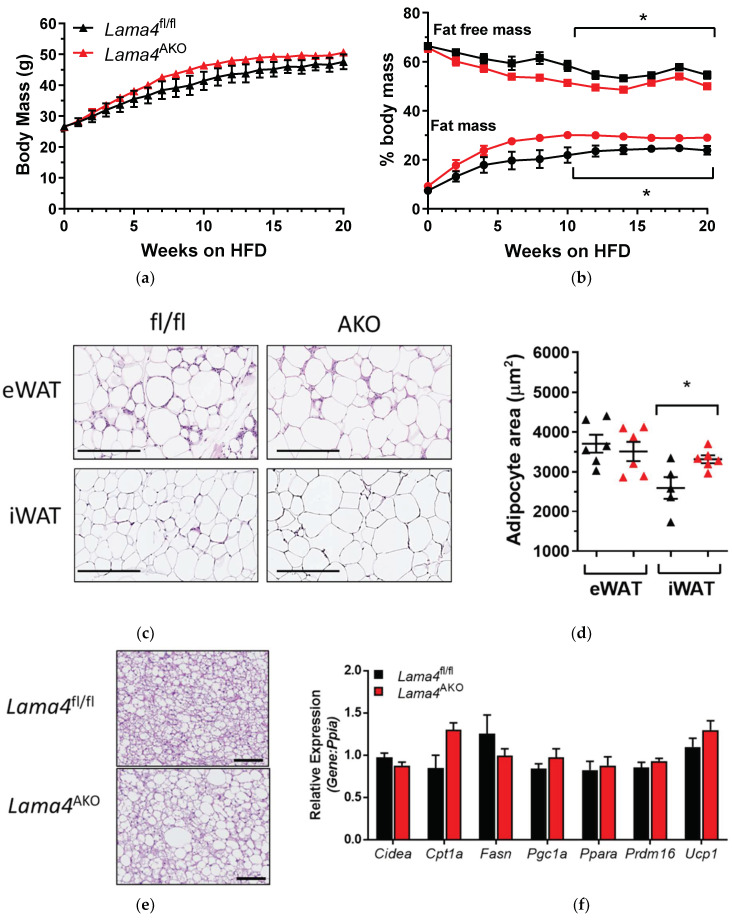
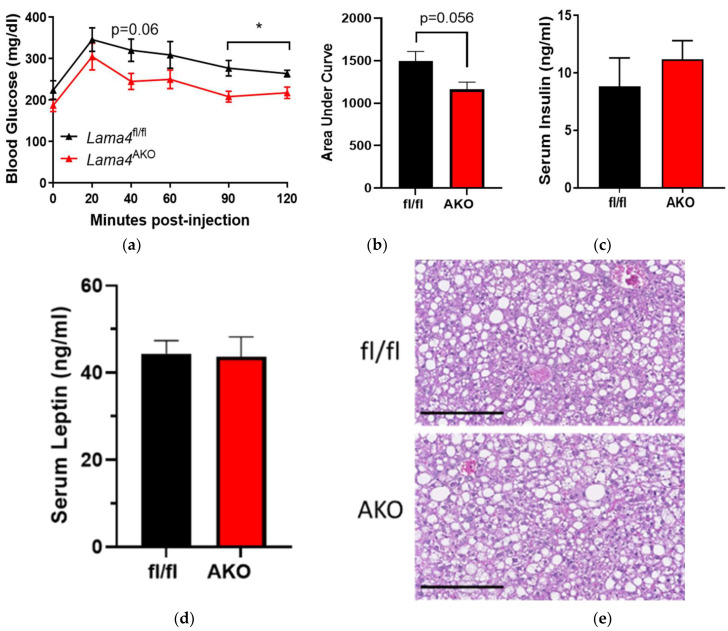
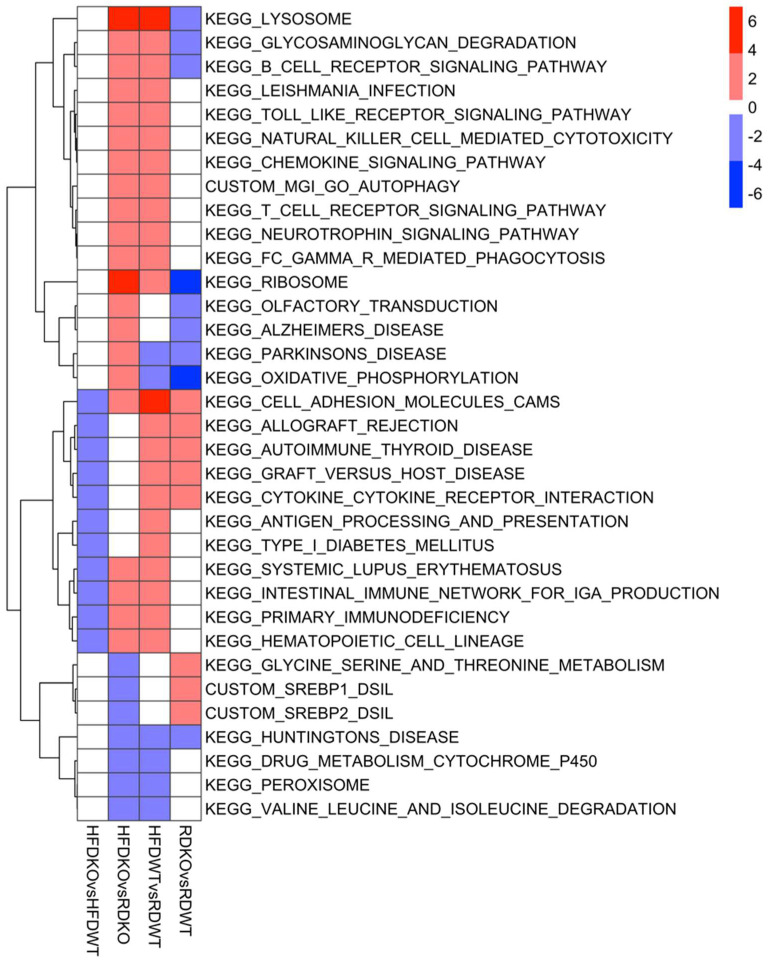
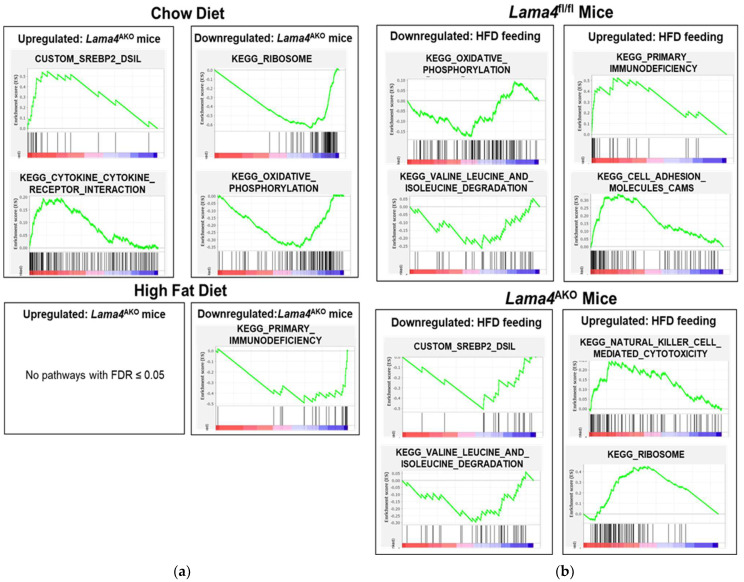
Laminins are heterotrimeric glycoproteins with structural and functional roles in basement membranes. The predominant laminin alpha chain found in adipocyte basement membranes is laminin α4 (LAMA4). Global LAMA4 deletion in mice leads to reduced adiposity and increased energy expenditure, but also results in vascular defects that complicate the interpretation of metabolic data. Here, we describe the generation and initial phenotypic analysis of an adipocyte-specific LAMA4 knockout mouse (Lama4AKO). We first performed an in-silico analysis to determine the degree to which laminin α4 was expressed in human and murine adipocytes. Next, male Lama4AKO and control mice were fed chow or high-fat diets and glucose tolerance was assessed along with serum insulin and leptin levels. Adipocyte area was measured in both epididymal and inguinal white adipose tissue (eWAT and iWAT, respectively), and eWAT was used for RNA-sequencing. We found that laminin α4 was highly expressed in human and murine adipocytes. Further, chow-fed Lama4AKO mice are like control mice in terms of body weight, body composition, and glucose tolerance, although they have larger eWAT adipocytes and lower insulin levels. High-fat-fed Lama4AKO mice are fatter and more glucose tolerant when compared to control mice. Transcriptionally, the eWAT of high-fat fed Lama4AKO mice resembles that of chow-fed control mice. We conclude from these findings that adipocyte-specific LAMA4 deletion is protective in an obesogenic environment, even though overall adiposity is increased.

Keywords: adipocyte; adipose tissue; basement membrane; extracellular matrix; laminin alpha 4; obesity.


Conflict of interest statement

The authors declare no conflict of interest. The funders had no role in the design of the study; in the collection, analyses, or interpretation of data; in the writing of the manuscript, or in the decision to publish the results.

Figures

Figure 1
Figure 1
Genetic strategy and targeting vector for generation of Lama4 loxP/loxP mice. White arrows indicate sites of primers used to determine correct homologous recombination in embryonic stem cell clones surviving positive/negative selection (GF & GR = genomic forward and reverse, respectively; NF and NR = Neo forward and reverse, respectively). Primer sequences appear in Appendix A.
Figure 2
Figure 2
Laminin α4 is highly expressed in human and mouse adipocytes. (a) Uniform manifold approximation and projection (UMAP) embedding coordinates from single nucleus RNA-sequencing data for adipocytes from human WAT, red = omental depot (11,475 nuclei depicted) and blue = subcutaneous depot (14,396 nuclei depicted). (b) LAMA4 expression overlaid on the UMAP coordinates from (a). (c) UMAP embedding coordinates for adipocytes from mouse WAT, red = epididymal depot (7620 nuclei depicted), blue = inguinal depot (21,921 nuclei depicted), and green = periovarian depot (10,393 nuclei depicted). (d) LAMA4 expression overlaid on the UMAP coordinates from (c). Data used are from [13].
Figure 2
Figure 2
Laminin α4 is highly expressed in human and mouse adipocytes. (a) Uniform manifold approximation and projection (UMAP) embedding coordinates from single nucleus RNA-sequencing data for adipocytes from human WAT, red = omental depot (11,475 nuclei depicted) and blue = subcutaneous depot (14,396 nuclei depicted). (b) LAMA4 expression overlaid on the UMAP coordinates from (a). (c) UMAP embedding coordinates for adipocytes from mouse WAT, red = epididymal depot (7620 nuclei depicted), blue = inguinal depot (21,921 nuclei depicted), and green = periovarian depot (10,393 nuclei depicted). (d) LAMA4 expression overlaid on the UMAP coordinates from (c). Data used are from [13].
Figure 3
Figure 3
Mice with adipocyte-specific LAMA4 deletion exhibit increased eWAT adipocyte area when maintained on a chow diet. Male Lama4fl/fl (fl/fl) and Lama4AKO (AKO) mice were provided a chow diet from weaning until 24 weeks of age; body weight was measured weekly and body composition was measured via NMR every other week. (a) Knockdown of Lama4 was confirmed in eWAT and iWAT; heart is shown as a positive control (n = 3–4 per genotype). Black bars represent Lama4fl/fl mice and red bars represent Lama4AKO mice. (b) There were no differences in body weight between Lama4fl/fl (black) and Lama4AKO mice (red) (n = 16–18 per genotype). (c) Adiposity did not differ between Lama4fl/fl (black) and Lama4AKO mice (red) (n = 16–18 per genotype). (d) Representative images of H&E-stained eWAT and iWAT (n = 4–6 per group). (e) Adipocyte area is significantly increased in eWAT, but not in iWAT, of chow-fed Lama4AKO mice (n = 4–7 per genotype per tissue). Black triangles represent Lama4fl/fl mice and red triangles represent Lama4AKO mice. * p < 0.05 and ** p < 0.01 between genotypes. Scale bars = 250 μm.
Figure 3
Figure 3
Mice with adipocyte-specific LAMA4 deletion exhibit increased eWAT adipocyte area when maintained on a chow diet. Male Lama4fl/fl (fl/fl) and Lama4AKO (AKO) mice were provided a chow diet from weaning until 24 weeks of age; body weight was measured weekly and body composition was measured via NMR every other week. (a) Knockdown of Lama4 was confirmed in eWAT and iWAT; heart is shown as a positive control (n = 3–4 per genotype). Black bars represent Lama4fl/fl mice and red bars represent Lama4AKO mice. (b) There were no differences in body weight between Lama4fl/fl (black) and Lama4AKO mice (red) (n = 16–18 per genotype). (c) Adiposity did not differ between Lama4fl/fl (black) and Lama4AKO mice (red) (n = 16–18 per genotype). (d) Representative images of H&E-stained eWAT and iWAT (n = 4–6 per group). (e) Adipocyte area is significantly increased in eWAT, but not in iWAT, of chow-fed Lama4AKO mice (n = 4–7 per genotype per tissue). Black triangles represent Lama4fl/fl mice and red triangles represent Lama4AKO mice. * p < 0.05 and ** p < 0.01 between genotypes. Scale bars = 250 μm.
Figure 4
Figure 4
Glucose tolerance is unchanged and postprandial insulin levels are decreased in chow-fed mice with adipocyte-specific LAMA4 deletion. Male Lama4fl/fl and Lama4AKO mice were provided a chow diet from weaning until 24 weeks of age. (a) Intraperitoneal glucose tolerance tests were performed after 18 weeks on diet (n = 15–16 mice per genotype after a 4-h fast). Serum (b) insulin levels and (c) leptin levels in fed mice (n = 6 per genotype) were measured by ELISA. (d) Representative images of H&E-stained liver sections (n = 5–7 per group), demonstrate no differences in hepatic lipid accumulation. Scale bars = 250 μm.
Figure 5
Figure 5
Mice with adipocyte-specific LAMA4 deletion have greater adiposity than control mice when challenged with HFD. Male Lama4fl/fl (fl/fl) and Lama4AKO (AKO) mice were provided HFD from 6–26 weeks of age; body weight was measured weekly and body composition was measured via NMR every other week. (a) There are no differences in body weight between Lama4fl/fl (black) and Lama4AKO mice (red) (n = 16–18 per genotype). (b) Adiposity is significantly greater and lean mass is significantly lower (n = 16–18 per genotype) in HFD-fed Lama4AKO mice (red) when compared to floxed controls (black). (c) Representative images of H&E-stained eWAT and iWAT (n = 4–7 per genotype). (d) Adipocyte area is increased in iWAT, but not in eWAT, of HFD-fed Lama4AKO mice (n = 4–7 per genotype). Black triangles represent Lama4fl/fl mice and red triangles represent Lama4AKO mice. (e) Larger lipid droplets are present in the BAT of HFD-fed Lama4AKO mice (n = 4–6 per group), but these morphological changes do not translate to altered BAT gene expression (f). * p < 0.05 between genotypes. Scale bars = 250 μm.
Figure 6
Figure 6
Glucose tolerance is improved, and postprandial insulin levels are unchanged in HFD-fed mice with adipocyte-specific LAMA4 deletion. Male Lama4fl/fl and Lama4AKO mice were provided HFD from 6–26 weeks of age. (a) Intraperitoneal glucose tolerance tests were performed after 18 weeks on diet (n = 15–16 mice per genotype after a 4-h fast). (b) The area under curve calculated from (a). (c) Insulin levels and (d) leptin levels in serum from fed mice (n = 6 per genotype) were measured by ELISA. (e) Representative images of H&E-stained liver sections (n = 5–7 per group). * p < 0.05 between genotypes. Scale bars = 250 μm.
Figure 7
Figure 7
Volcano plots depicting differential eWAT expression patterns across diet (chow or HFD) or genotype (Lama4fl/fl mice or Lama4AKO) comparisons. (a) High-fat vs. chow diet comparison in Lama4fl/fl mice; (b) High-fat vs. chow diet comparison in Lama4AKO mice; (c) Lama4fl/fl mice vs. Lama4AKO mice on a high-fat diet; (d) Lama4fl/fl mice vs. Lama4AKO mice on chow diet. RD = chow diet, HFD = high-fat diet, WT = Lama4fl/fl and KO = Lama4AKO. The top 20 differentially expressed genes are annotated in each volcano plot, with full gene names appearing in Appendix B. Dashed lines represent the significance cutoffs for identifying genes as significantly regulated.
Figure 7
Figure 7
Volcano plots depicting differential eWAT expression patterns across diet (chow or HFD) or genotype (Lama4fl/fl mice or Lama4AKO) comparisons. (a) High-fat vs. chow diet comparison in Lama4fl/fl mice; (b) High-fat vs. chow diet comparison in Lama4AKO mice; (c) Lama4fl/fl mice vs. Lama4AKO mice on a high-fat diet; (d) Lama4fl/fl mice vs. Lama4AKO mice on chow diet. RD = chow diet, HFD = high-fat diet, WT = Lama4fl/fl and KO = Lama4AKO. The top 20 differentially expressed genes are annotated in each volcano plot, with full gene names appearing in Appendix B. Dashed lines represent the significance cutoffs for identifying genes as significantly regulated.
Figure 8
Figure 8
Venn diagram depicting the overlap among differentially expressed genes from each diet (chow or HFD) or genotype (Lama4fl/fl mice or Lama4AKO) comparison. RD = chow diet, HFD = high-fat diet, WT = Lama4fl/fl and KO = Lama4AKO.
Figure 9
Figure 9
Boxplots of top ten genes differentially expressed in common between HFD-fed Lama4fl/fl and Lama4AKO mice, as well as between HFD and chow-fed Lama4fl/fl mice. log2CPM = log 2 counts per million, RD = chow diet, HFD = high-fat diet, WT = Lama4fl/fl and KO = Lama4AKO. Atf2 = activating transcription factor 2, Btbd10 = BTB domain containing 10, Fgfr1op2 = FGFR1 oncogene partner 2, Grcc10 = gene-rich cluster, C10 gene, Gtf2h1 = general transcription factor IIH subunit 1, Larp4 = La ribonucleoprotein 4, Mrpl9 = mitochondrial ribosomal protein L9, Pex2 = peroxisomal biogenesis factor 2, Srpr = signal recognition particle receptor subunit alpha.
Figure 10
Figure 10
Heatmap summarizing significantly up—(red) or down—(blue) regulated as determined by GSEA (FDR ≤ 0.05). Pathways showing significant regulation (FDR ≤ 0.05) in two or more diet or genotype comparisons are shown. RD = chow diet, HFD = high-fat diet, WT = Lama4fl/fl (control) mice, KO = Lama4AKO mice. For the HFDKO vs. HFDWT column, pathway directionality reported is for the HFDWT group (i.e., red = upregulated in HFDWT vs. HFDKO). For the HFDKO vs. RDKO column, directionality is reported for the RDKO group. For the HFDWT vs. RDWT and RDKO vs. RDWT columns, directionality is reported for the RDWT group.
Figure 11
Figure 11
Enrichment plots of selected pathways significantly up-or down-regulated (FDR ≤ 0.05) in two or more diet or genotype comparisons as determined by GSEA and summarized in Figure 10. (a) Genotype comparisons revealed that sterol and immune pathways were upregulated, while ribosomal and oxidative phosphorylation pathways were downregulated, in chow-fed Lama4AKO mice when compared to chow-fed controls. Conversely, no pathways were upregulated, while immune pathways were downregulated in HFD-fed Lama4AKO mice when compared to controls. (b) Diet comparisons revealed significant downregulation of metabolism-related pathways and upregulation of inflammatory pathways upon HFD feeding compared to chow feeding in Lama4fl/fl mice. A similar pattern of pathway changes was also observed in Lama4AKO mice with HFD feeding.

Similar articles

Cited by

References

    1. Sasaki T., Fässler R., Hohenester E. Laminin: The crux of basement membrane assembly. J. Cell Biol. 2004;164:959–963. doi: 10.1083/jcb.200401058. - DOI - PMC - PubMed
    1. Abrass C.K., Hansen K.M., Patton B.L. Laminin α4-Null Mutant Mice Develop Chronic Kidney Disease with Persistent Overexpression of Platelet-Derived Growth Factor. Am. J. Pathol. 2010;176:839–849. doi: 10.2353/ajpath.2010.090570. - DOI - PMC - PubMed
    1. Hohenester E., Yurchenco P.D. Laminins in basement membrane assembly. Cell Adhes. Migr. 2013;7:56–63. doi: 10.4161/cam.21831. - DOI - PMC - PubMed
    1. Vaicik M.K., Blagajcevic A., Ye H., Morse M.C., Yang F., Goddi A., Brey E.M., Cohen R.N. The Absence of Laminin alpha4 in Male Mice Results in Enhanced Energy Expenditure and Increased Beige Subcutaneous Adipose Tissue. Endocrinology. 2018;159:356–367. doi: 10.1210/en.2017-00186. - DOI - PMC - PubMed
    1. Yurchenco P.D. Basement membranes: Cell scaffoldings and signaling platforms. Cold Spring Harb. Perspect. Biol. 2011;3:a004911. doi: 10.1101/cshperspect.a004911. - DOI - PMC - PubMed