. 2022 Aug 31;10(9):2138.
doi: 10.3390/biomedicines10092138.

MRI Detection of Hepatic N-Acetylcysteine Uptake in Mice

Affiliations

MRI Detection of Hepatic N-Acetylcysteine Uptake in Mice

Johnny Chen et al. Biomedicines. .

Abstract

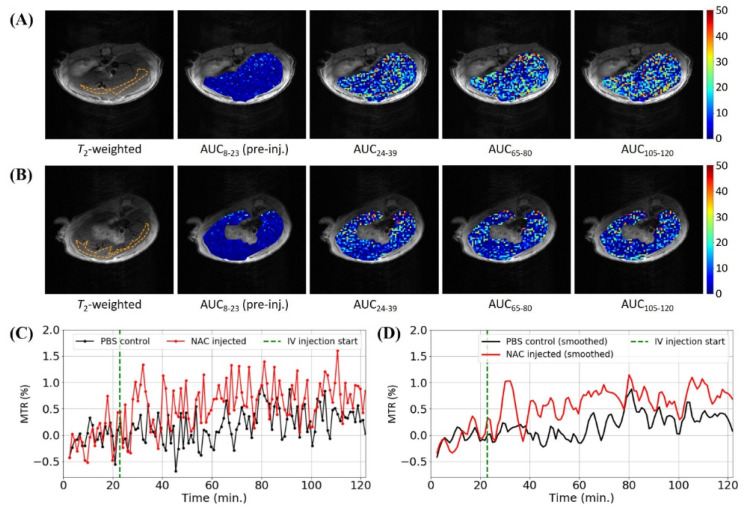
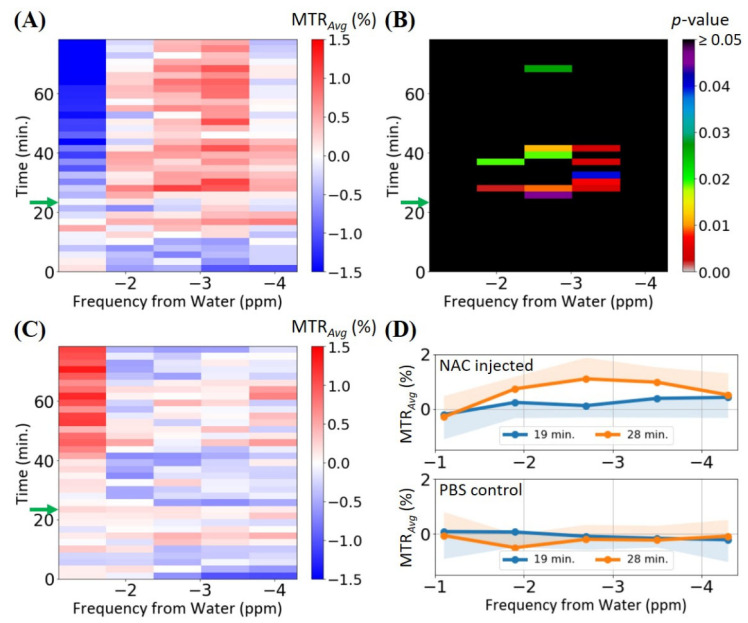
This proof-of-concept study looked at the feasibility of using a thiol-water proton exchange (i.e., CEST) MRI contrast to detect in vivo hepatic N-acetylcysteine (NAC) uptake. The feasibility of detecting NAC-induced glutathione (GSH) biosynthesis using CEST MRI was also investigated. The detectability of the GSH amide and NAC thiol CEST effect at B0 = 7 T was determined in phantom experiments and simulations. C57BL/6 mice were injected intravenously (IV) with 50 g L-1 NAC in PBS (pH 7) during MRI acquisition. The dynamic magnetisation transfer ratio (MTR) and partial Z-spectral data were generated from the acquisition of measurements of the upfield NAC thiol and downfield GSH amide CEST effects in the liver. The 1H-NMR spectroscopy on aqueous mouse liver extracts, post-NAC-injection, was performed to verify hepatic NAC uptake. The dynamic MTR and partial Z-spectral data revealed a significant attenuation of the mouse liver MR signal when a saturation pulse was applied at -2.7 ppm (i.e., NAC thiol proton resonance) after the IV injection of the NAC solution. The 1H-NMR data revealed the presence of hepatic NAC, which coincided strongly with the increased upfield MTR in the dynamic CEST data, providing strong evidence that hepatic NAC uptake was detected. However, this MTR enhancement was attributed to a combination of NAC thiol CEST and some other upfield MT-generating mechanism(s) to be identified in future studies. The detection of hepatic GSH via its amide CEST MRI contrast was inconclusive based on the current results.

Keywords: N-acetylcysteine; chemical exchange saturation transfer (CEST); glutathione; thiol proton exchange.


Conflict of interest statement

The authors declare no conflict of interest.

Figures

Figure 1
Figure 1
(A) The half-echo acquisition mode CEST-UTE pulse sequence [24]. After a 30 ms Gaussian saturation RF pulse, a crusher and pre-spoil slice-selective (Gs) gradient was applied, followed by a 1 ms slice-selective Gaussian excitation pulse with a 10° flip angle. Subsequently, the phase-encoding (Gφ) and readout (Gr) gradients were switched on during the signal acquisition to acquire a single radial spoke in k-space. (B) The experimental procedure used in this study. In the procedure, following a fasting period to reduce liver GSH levels, a dynamic scan was performed to monitor the hepatic NAC uptake and GSH increase as a function of time. The injection (green arrow) of NAC began at 23 min into the dynamic scan. (C) The three different frequency lists (FL1, FL2 and FL3) used for the dynamic scan experiments. For FL1, after the 12 dummy scans with the ωtx at 333 ppm, the ωtx was alternated between −2.7 and 3.6 ppm. From the two iterations of the −2.7 ppm images, only the signal intensity from the second image was used in the dynamic MTR curve; the same procedure was applied to the 3.6 ppm images. For FL2 and FL3, after the 9 dummy scans, the partial Z-spectra were repeatedly acquired between −4.3 and −1.1 ppm (NAC thiol) or 4.2 and 3.0 ppm (GSH amide). Again, only the image from the second iteration of each frequency was used in the dynamic MTR curve. The interleaved 333 ppm scans were used to establish a S0 baseline for the dynamic MTR curve data.
Figure 2
Figure 2
Dynamic CEST data of the representative test (i.e., NAC-injected) (A) and control (i.e., PBS-injected) (B) mice obtained through saturating at −2.7 ppm using the CEST-UTE pulse sequence. (A) The T2-weighted transverse slice of the mouse which was injected (IV) with NAC with its liver overlaid with multiple AUC maps. (B) The T2-weighted transverse slice of the mouse which was injected (IV) with PBS (control) with its liver overlaid with multiple AUC maps. The orange, dashed outline in first T2-weighted images in (A,B) represent the ROIs selected for plotting the dynamic MTR curves (C). (D) The smoothed version of the dynamic MTR curves in (C) using the Savitzky–Golay filter. The green dashed line in (C) represents the start of the IV injection.
Figure 3
Figure 3
(A) The dynamic MTRAvg curves, with the shaded regions representing the upper and lower standard deviations for the test and control group, respectively, obtained through saturating at −2.7 ppm (NAC thiol proton resonance) for the test (n = 5) and control (n = 5) mouse groups. (B) The smoothed version of the dynamic MTRAvg curves in (A) using the Savitzky–Golay filter. (C) A box-whisker plot of the test and control group MTR values at 30 min (i.e., 6 min post-injection) (Welch’s t-test: *, p = 0.007). The boxes, whiskers, orange lines and green triangles represent the first quartiles of the data, the data extremities, the median MTR values and the average MTR values, respectively. (D) A comparison between the MTR values of the test group at several time points (Student’s paired t-test: *, p = 0.003; **, p = 0.015; ***, p = 0.073). (E) A comparison between the MTR values of the control group at several time points (Student’s paired t-test: *, p = 0.757; **, p = 0.787; ***, p = 0.034).
Figure 4
Figure 4
The partial Z-spectral (−4.3–−1.1 ppm) data for the test (n = 5) and control (n = 5) mouse groups. (A) A 2D map showing the MTRAvg magnitudes for the test group as a function of chemical shift from water and experimental time. (B) A 2D map showing the experimental time and chemical shift regions where the test group’s MTRAvg values were statistically different from the control group’s MTRAvg values with p < 0.05 (Welch’s t-test). (C) A 2D map showing the MTRAvg magnitudes for the control group as a function of chemical shift from water and experimental time. (D) The MTRAvg values of the partial Z-spectra at 19 min (i.e., pre-injection) and 28 min (i.e., post-injection) for the test and control groups, with the shaded regions representing the lower and upper standard deviations for the partial Z-spectra obtained at 19 and 28 min, respectively. The height of each cell in (AC) represents the experimental time required to acquire a single partial Z-spectrum. The five cells in each row in (AC) correspond to the five discrete chemical shift values of the partial Z-spectra. The green arrows in (AC) represent the start of the IV injection.
Figure 5
Figure 5
A close-up (1.8–2.3 ppm) of the 1H-NMR spectra of aqueous mouse liver extracts from the test (n = 6) and control (n = 6) groups to show the presence and absence of the distinct NAC methyl proton singlet at ~2.06 ppm (shaded) in the test and control groups, respectively. The resonances of GSH, GSSG, glutamine (Gln) and acetate (Ace) were also identified for reference [34,35].

Similar articles

References

    1. Pettie J.M., Caparrotta T.M., Hunter R.W., Morrison E.E., Wood D.M., Dargan P.I., Thanacoody R.H., Thomas S.H., Elamin M.E., Francis B., et al. Safety and efficacy of the SNAP 12-hour acetylcysteine regimen for the treatment of paracetamol overdose. eClinicalMedicine. 2019;11:11–17. doi: 10.1016/j.eclinm.2019.04.005. - DOI - PMC - PubMed
    1. Heard K.J. Acetylcysteine for acetaminophen poisoning. N. Engl. J. Med. 2008;359:285–292. doi: 10.1056/NEJMct0708278. - DOI - PMC - PubMed
    1. Knudsen T.T., Thorsen S., Jensen S.A., Dalhoff K., Schmidt L.E., Becker U., Bendtsen F. Effect of intravenous N-acetylcysteine infusion on haemostatic parameters in healthy subjects. Gut. 2005;54:515–521. doi: 10.1136/gut.2004.043505. - DOI - PMC - PubMed
    1. Prescott L.F., Donovan J.W., Jarvie D.R., Proudfoot A.T. The disposition and kinetics of intravenous N-acetylcysteine in patients with paracetamol overdosage. Eur. J. Clin. Pharmacol. 1989;37:501–506. doi: 10.1007/BF00558131. - DOI - PubMed
    1. Lauterburg B.H., Corcoran G.B., Mitchell J.R. Mechanism of action of N-acetylcysteine in the protection against the hepatotoxicity of acetaminophen in rats in vivo. J. Clin. Investig. 1983;71:980–991. doi: 10.1172/JCI110853. - DOI - PMC - PubMed

LinkOut - more resources