

A Transcriptomic Analysis of Phenotypic Plasticity in Crassostrea virginica Larvae under Experimental Acidification
- PMID: 36140697
- PMCID: PMC9498863
- DOI: 10.3390/genes13091529
A Transcriptomic Analysis of Phenotypic Plasticity in Crassostrea virginica Larvae under Experimental Acidification
Abstract
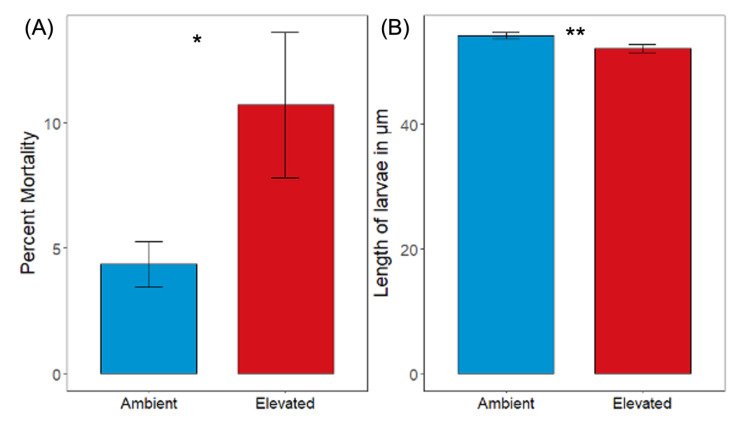
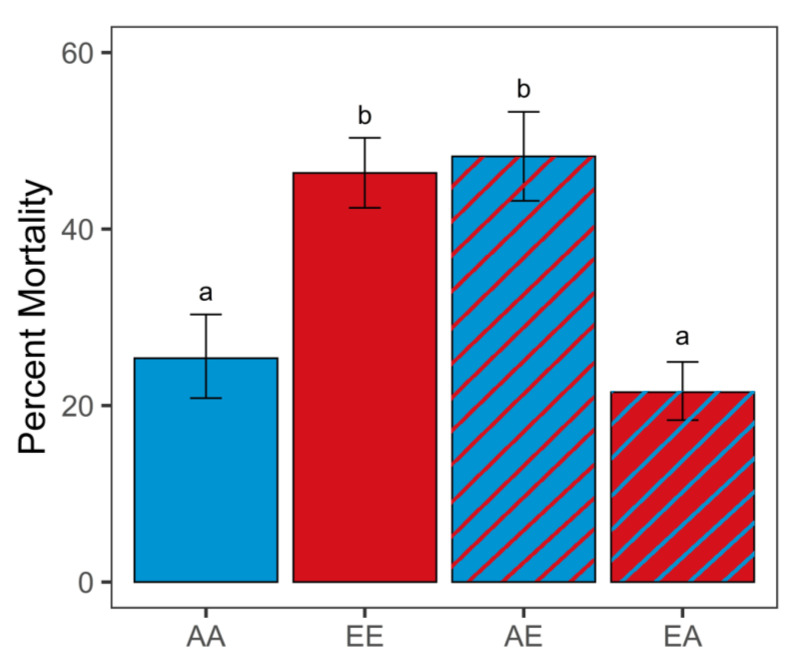
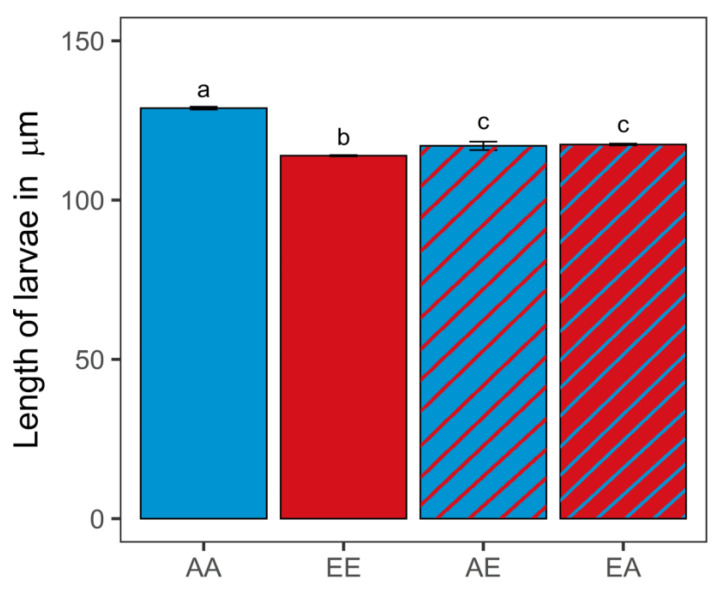
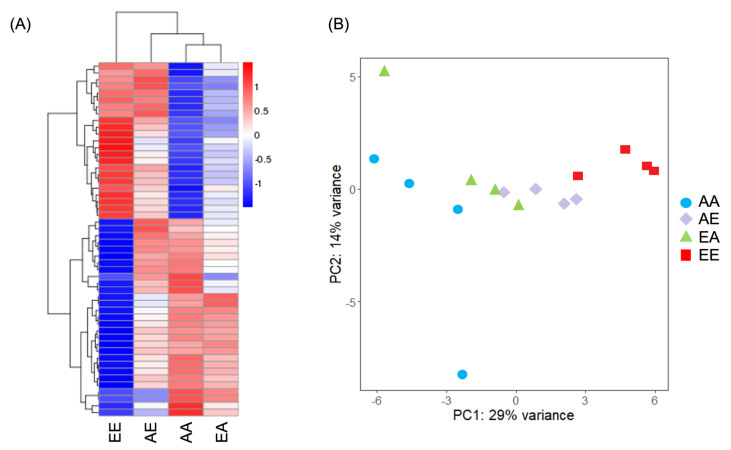
Ocean acidification (OA) is a major threat to marine calcifiers, and little is known regarding acclimation to OA in bivalves. This study combined physiological assays with next-generation sequencing to assess the potential for recovery from and acclimation to OA in the eastern oyster (Crassostrea virginica) and identify molecular mechanisms associated with resilience. In a reciprocal transplant experiment, larvae transplanted from elevated pCO2 (~1400 ppm) to ambient pCO2 (~350 ppm) demonstrated significantly lower mortality and larger size post-transplant than oysters remaining under elevated pCO2 and had similar mortality compared to those remaining in ambient conditions. The recovery after transplantation to ambient conditions demonstrates the ability for larvae to rebound and suggests phenotypic plasticity and acclimation. Transcriptomic analysis supported this hypothesis as genes were differentially regulated under OA stress. Transcriptomic profiles of transplanted and non-transplanted larvae terminating in the same final pCO2 converged, further supporting the idea that acclimation underlies resilience. The functions of differentially expressed genes included cell differentiation, development, biomineralization, ion exchange, and immunity. Results suggest acclimation as a mode of resilience to OA. In addition, the identification of genes associated with resilience can serve as a valuable resource for the aquaculture industry, as these could enable marker-assisted selection of OA-resilient stocks.
Keywords: RNASeq; acclimation; ocean acidification; oyster.
Conflict of interest statement
The authors declare no conflict of interest.
Figures
References
-
- IPCC . In: Climate Change 2014: Synthesis Report. Contribution of Working Groups I, II and III to the Fifth Assessment Report of the Intergovernmental Panel on Climate Change. Core Writing Team; Pachauri R.K., Meyer L.A., editors. IPCC; Geneva, Switzerland: 2014.
-
- Wallace R.B., Baumann H., Grear J.S., Aller R.C., Gobler C.J. Coastal ocean acidification: The other eutrophication problem. Estuar. Coast. Shelf. Sci. 2014;148:1–13. doi: 10.1016/j.ecss.2014.05.027. - DOI
-
- Ekstrom J.A., Suatoni L., Cooley S.R., Pendleton L.H., Waldbusser G.G., Cinner J.E., Ritter J., Langdon C., Van Hooidonk R., Gledhill D., et al. Vulnerability and adaptation of US shellfisheries to ocean acidification. Nat. Clim. Chang. 2015;5:207–214. doi: 10.1038/nclimate2508. - DOI
-
- Ries J.B., Cohen A.L., McCorkle D.C. Marine calcifiers exhibit mixed responses to CO2-induced ocean acidification. Geol. Soc. Am. 2009;37:1134. doi: 10.1130/G30210A.1. - DOI
Publication types
MeSH terms
Substances
LinkOut - more resources
Full Text Sources
