. 2022 Sep 14;19(18):11583.
doi: 10.3390/ijerph191811583.

Potential Impacts of Different Occupational Outdoor Heat Exposure Thresholds among Washington State Crop and Construction Workers and Implications for Other Jurisdictions

Affiliations

Potential Impacts of Different Occupational Outdoor Heat Exposure Thresholds among Washington State Crop and Construction Workers and Implications for Other Jurisdictions

John C Flunker et al. Int J Environ Res Public Health. .

Abstract

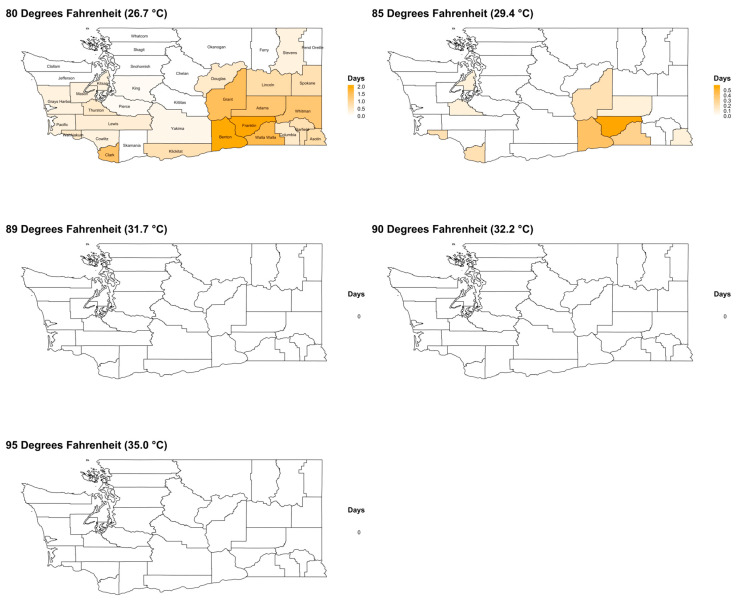
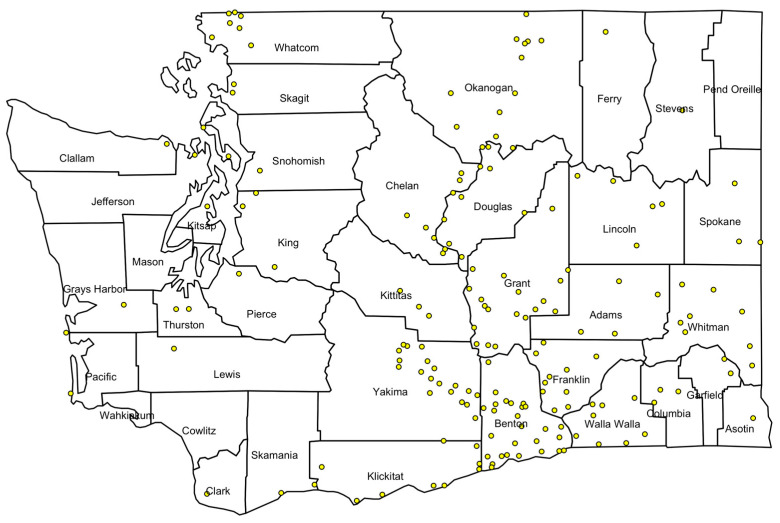
Occupational heat exposure is associated with substantial morbidity and mortality among outdoor workers. We sought to descriptively evaluate spatiotemporal variability in heat threshold exceedances and describe potential impacts of these exposures for crop and construction workers. We also present general considerations for approaching heat policy-relevant analyses. We analyzed county-level 2011-2020 monthly employment (Bureau of Labor Statistics Quarterly Census of Employment and Wages) and environmental exposure (Parameter-elevation Relationships on Independent Slopes Model (PRISM)) data for Washington State (WA), USA, crop (North American Industry Classification System (NAICS) 111 and 1151) and construction (NAICS 23) sectors. Days exceeding maximum daily temperature thresholds, averaged per county, were linked with employment estimates to generate employment days of exceedances. We found spatiotemporal variability in WA temperature threshold exceedances and crop and construction employment. Maximum temperature exceedances peaked in July and August and were most numerous in Central WA counties. Counties with high employment and/or high numbers of threshold exceedance days, led by Yakima and King Counties, experienced the greatest total employment days of exceedances. Crop employment contributed to the largest proportion of total state-wide employment days of exceedances with Central WA counties experiencing the greatest potential workforce burden of exposure. Considerations from this analysis can help inform decision-making regarding thresholds, timing of provisions for heat rules, and tailoring of best practices in different industries and areas.

Keywords: Washington State; crop and construction employment; heat rule; maximum temperature exceedances; occupational heat exposure; outdoor workers; policy.


Conflict of interest statement

The authors declare no conflict of interest.

Figures

Figure A1
Figure A1
Maps of the annual average number of days from April to October at or above PRISM-derived temperature thresholds by WA county, 2011–2020. Note: Color gradient scale differs per temperature threshold map. Note: San Juan County and Island County are not labeled.
Figure A2
Figure A2
Average number of days at or above PRISM-derived temperature thresholds and employment (in thousands) by county and month for crop/crop support, and construction employment, 2011–2020. Dashed line: NAICS 23 (Construction); solid line: NAICS 111 (Crop production) and NAICS 1151 (Support Activities for Crop Production). Note: Month is abbreviated as the first three letters of each month.
Figure A3
Figure A3
The annual average employment days (thousands) per year from October to April at or above PRISM-derived temperature threshold of 80 degrees Fahrenheit by county and for crop and construction employment, 2011–2020. Note: San Juan County and Island County are not labeled.
Figure A4
Figure A4
Map of WA AgWeatherNet (AWN) station locations. Yellow outlined dots represent AWN station locations. Note: San Juan County and Island County are not labeled.
Figure A5
Figure A5
Maps of the annual average number of days from May to September at or above AWN-derived temperature thresholds by WA county, 2011–2020. Note: Color scale differs per temperature threshold. San Juan County and Island County are not labeled.
Figure A6
Figure A6
Maps of the annual average number of days from October–April at or above AWN-derived temperature thresholds by WA county, 2011–2020. Note: Color scale differs per temperature threshold. San Juan County and Island County are not labeled.
Figure A7
Figure A7
Maps of the annual average number of AWN-derived heatwave days, May–September and October–April, 2011–2020. Note: San Juan County and Island County are not labeled.
Figure 1
Figure 1
Maps of the annual average number of days from May to September at or above PRISM-derived temperature thresholds by WA county, 2011–2020. Note: Color gradient scale differs per temperature threshold map. San Juan and Island counties are not labeled.
Figure 2
Figure 2
Average number of days at or above PRISM-derived temperature thresholds and employment by county and month for crop, crop support, and construction employment, 2011–2020. Dashed line: NAICS 23 (Construction); solid line: NAICS 111 (Crop production) and NAICS 1151 (Support Activities for Crop Production). Note: Month is abbreviated as the first three letters of each month.
Figure 3
Figure 3
Maps of the annual average employment (thousands) for total employment, construction, and crop/crop support by county, averaged over the months of May–September, 2011–2020.
Figure 4
Figure 4
The annual average employment days (thousands) from May to September at or above PRISM-derived temperature threshold of 80 degrees Fahrenheit (26.7 °C) by county and for crop and construction employment, 2011–2020. Note: San Juan County and Island County are not labeled.
Figure 5
Figure 5
Map of the annual average total employment days (thousands) affected by AWN-derived heatwave days for crop and crop support by county from May to September, 2011–2020. Note: San Juan County and Island County are not labeled.

References

    1. Gubernot D.M., Anderson G.B., Hunting K.L. Characterizing occupational heat-related mortality in the United States, 2000-2010: An analysis using the census of fatal occupational injuries database. Am. J. Ind. Med. 2015;58:203–211. doi: 10.1002/ajim.22381. - DOI - PMC - PubMed
    1. Hesketh M., Wuellner S., Robinson A., Adams D., Smith C., Bonauto D. Heat related illness among workers in Washington State: A descriptive study using workers’ compensation claims, 2006–2017. Am. J. Ind. Med. 2020;63:300–311. doi: 10.1002/ajim.23092. - DOI - PubMed
    1. Heinzerling A., Laws R.L., Frederick M., Jackson R., Windham G., Materna B., Harrison R. Risk factors for occupational heat–related illness among California workers, 2000–2017. Am. J. Ind. Med. 2020;63:1145–1154. doi: 10.1002/ajim.23191. - DOI - PubMed
    1. Moyce S., Joseph J., Tancredi D., Mitchell D., Schenker M. Cumulative Incidence of Acute Kidney Injury in California’s Agricultural Workers. J. Occup. Environ. Med. 2016;58:391–397. doi: 10.1097/JOM.0000000000000668. - DOI - PubMed
    1. Shi D.S., Weaver V.M., Hodgson M.J., Tustin A.W. Hospitalised heat-related acute kidney injury in indoor and outdoor workers in the USA. Occup. Environ. Med. 2022;79:184–191. doi: 10.1136/oemed-2021-107933. - DOI - PubMed

Publication types