. 2022 Sep 6;23(18):10231.
doi: 10.3390/ijms231810231.

Multiple Perspectives Reveal the Role of DNA Damage Repair Genes in the Molecular Classification and Prognosis of Pancreatic Adenocarcinoma

Affiliations

Multiple Perspectives Reveal the Role of DNA Damage Repair Genes in the Molecular Classification and Prognosis of Pancreatic Adenocarcinoma

Yujie Li et al. Int J Mol Sci. .

Abstract

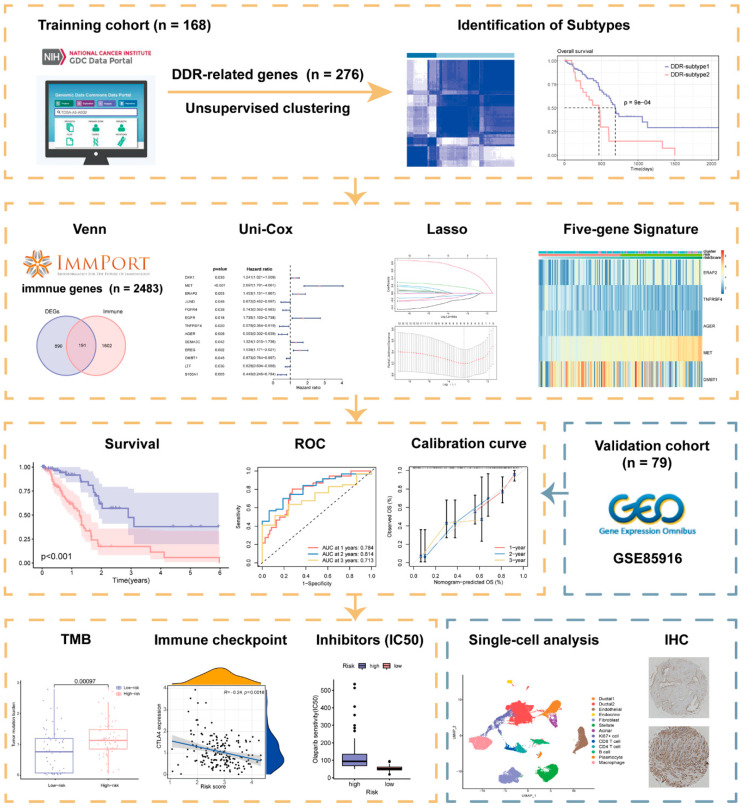
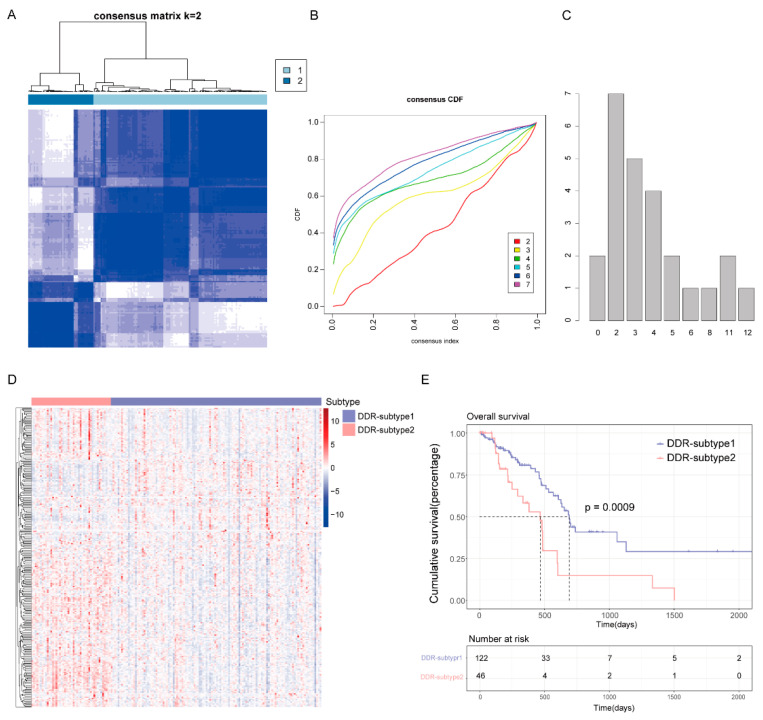
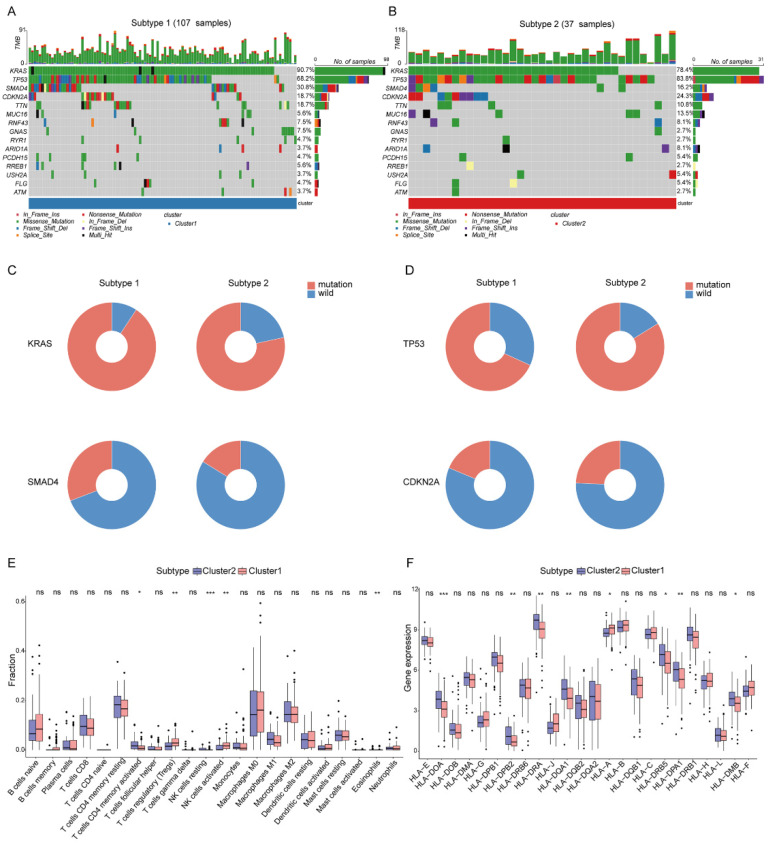
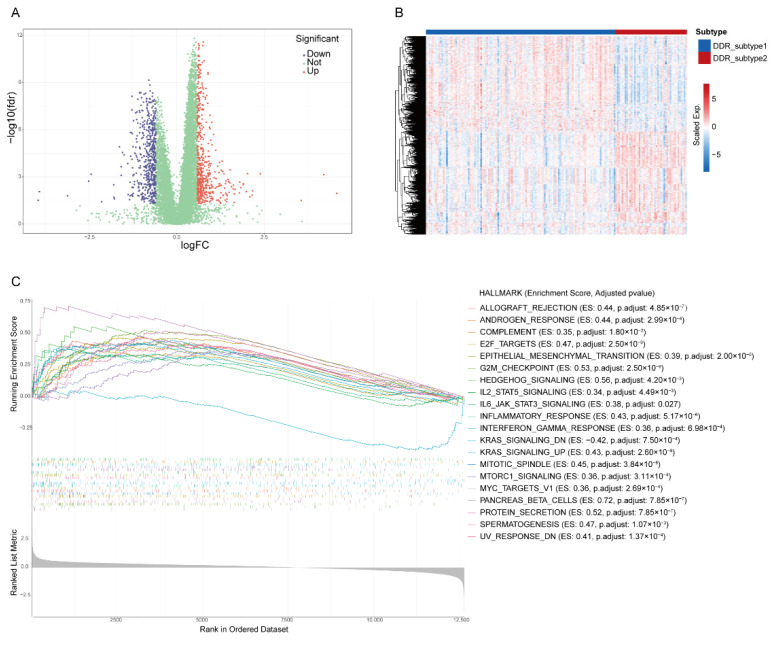
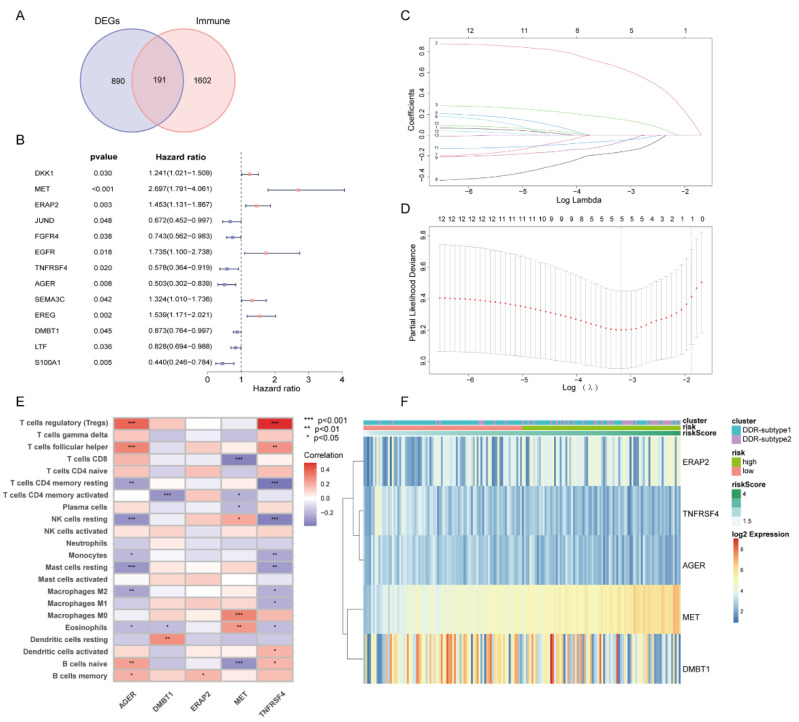
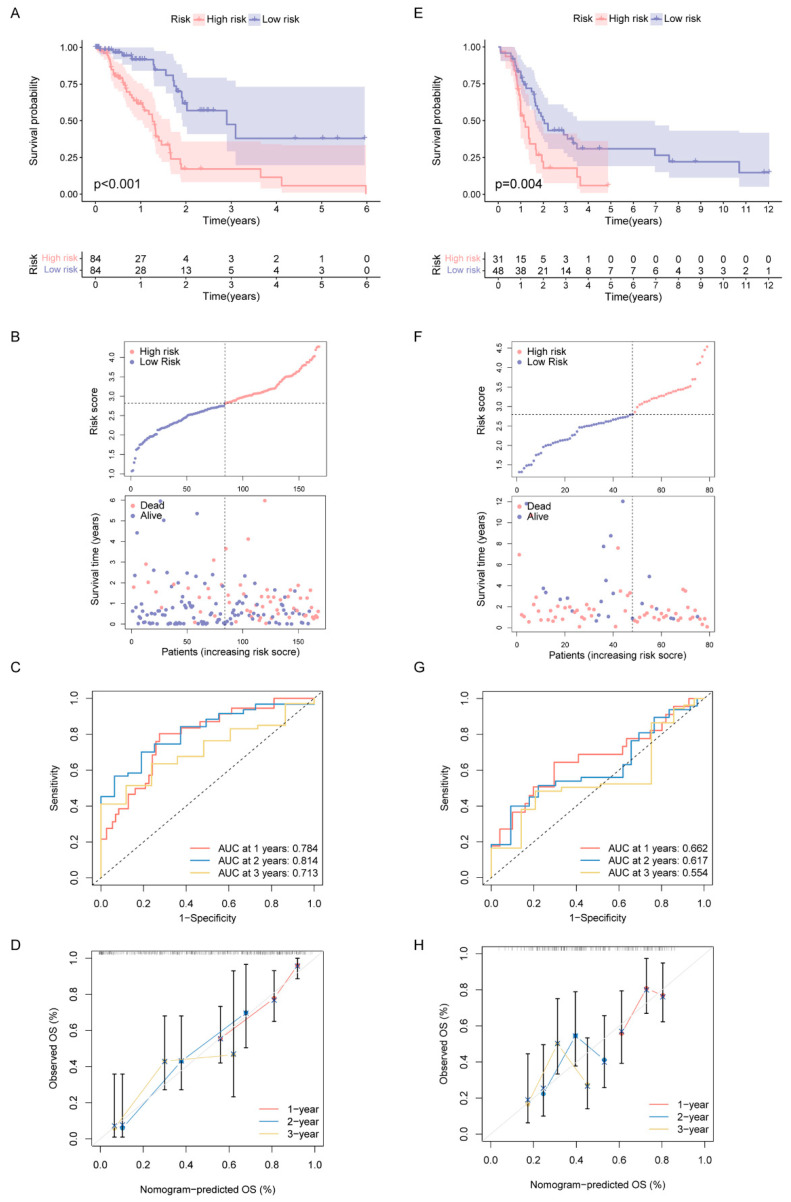
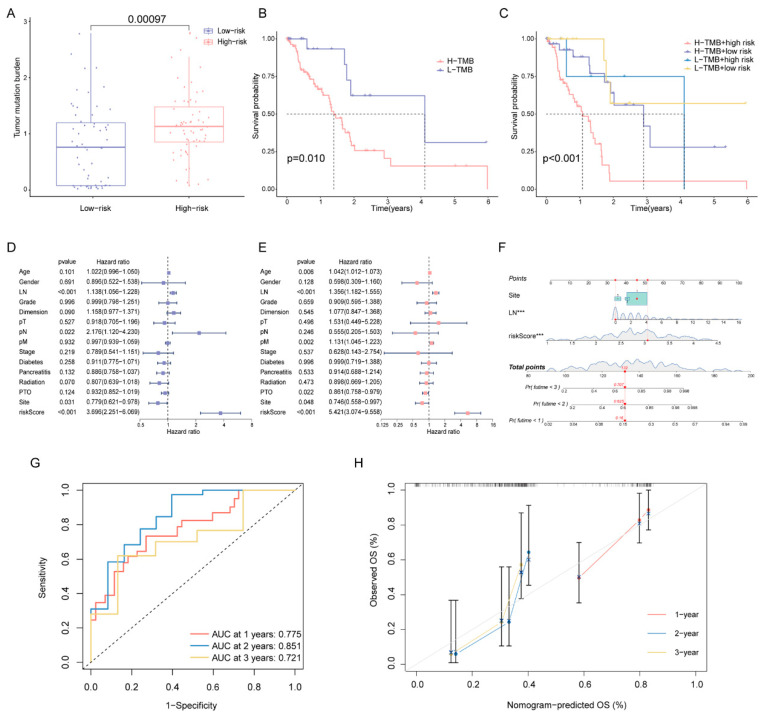
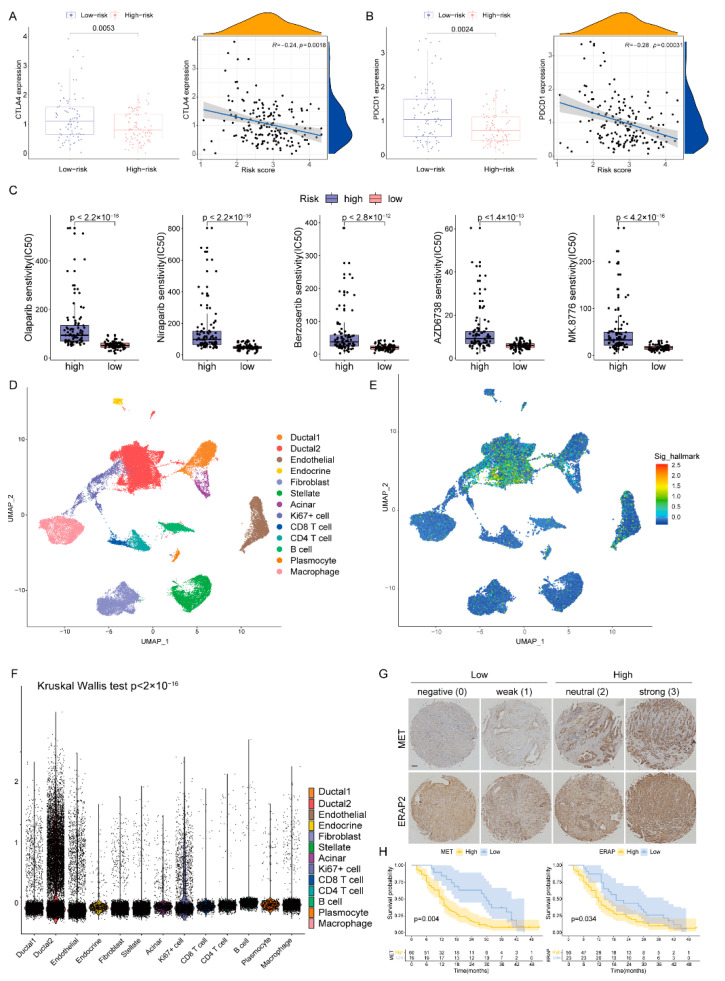
Pancreatic adenocarcinoma (PAAD) is a highly heterogeneous and immunosuppressive cancer. This study investigated the diversity of DNA damage repair (DDR) and immune microenvironment in PAAD by transcriptomic and genomic analysis. Patients with PAAD were divided into two DDR-based subtypes with distinct prognosis and molecular characteristics. The differential expression genes were mostly enriched in DDR and immune-related pathways. In order to distinguish high- and low-risk groups clinically, a DDR- and immune-based 5-gene prognostic signature (termed DPRS) was established. Patients in the high-risk group had inferior prognosis, a low level of immune checkpoint gene expression and low sensitivity to DDR-associated inhibitors. Furthermore, single-cell sequencing was used to observe the performance of the DDR-based signature in a high dimension, and immunohistochemistry was used to verify the relationship between the genes we identified and the prognosis of patients with PAAD. In conclusion, the DDR heterogeneity of PAAD was demonstrated, and a novel DDR- and immune-based risk-scoring model was constructed, which indicated the feasibility of DPRS in predicting prognosis and drug response in PAAD patients.

Keywords: DNA damage repair; immune; molecular classification; pancreatic adenocarcinoma; prognosis.


Conflict of interest statement

The authors declare no conflict of interest.

Figures

Figure 1
Figure 1
Workflow of the current study.
Figure 2
Figure 2
Consensus clustering for DNA damage repair (DDR) related genes in the TCGA-PAAD cohort (n = 168). (A) The consensus matrix of the DDR-related genes. (B) Cumulative distribution function (CDF) plot with consensus values ranging from 0 to 1. (C) The Nbclust plot represented the chosen optimal cluster number (k = 2) for DDR genes. (D) Heatmap of DDR-related genes in DDR subtypes. (E) Overall survival (OS) of patients in DDR-subtype1 and subtype2.
Figure 3
Figure 3
Somatic mutation and immune features between subgroups. Landscape of mutation profiles in DDR-subtype1 (A) and DDR-subtype2 (B). Mutation information of each gene in each sample is shown in the waterfall plot. Top panel shows individual tumor mutation burden. (C) Patients with DDR-subtype1 showed higher mutation frequencies of KRAS and SMAD4; (D) Patients with DDR-subtype2 showed higher mutation frequencies of TP53 and CDKN2A. Immune profile alterations (E) and human leukocyte antigen (F) between the DDR-subtypes. * represents p < 0.05, ** represents p < 0.01, *** represents p < 0.001, ns represents no significant difference.
Figure 4
Figure 4
Identification of differential expression genes (DEGs) and related biological processes of DDR subtypes. Volcano plot (A) and heatmap (B) of DEGs in PAAD based on data from TCGA. (C) The top 20 hallmark gene sets of Gene Set Enrichment Analysis of DEGs.
Figure 5
Figure 5
Generation of DDR- and immune-based signature. (A) Venn-diagram-described DDR-based DEGs (n = 1081) were intersected with the immune genes (n = 2483) and altogether 191 overlapping genes were screened. (B) Forest plot of univariate Cox regression analysis showed that 13 DEGs were associated with prognosis. (C) LASSO coefficient profiles. (D) Selection of the tuning parameter (lambda) in the LASSO model by 10-fold cross-validation based on minimum criteria for OS. (E) Heatmap of relationship between the 5-gene signature and immune infiltration. (F) Heatmap of 5-gene signature by unsupervised clustering. The DDR subtype, risk group and risk score as gene annotations were correlated.
Figure 6
Figure 6
Construction and validation of DDR- and immune-based risk score (DPRS) model. (AD) Construction and validation of TCGA training set. (A) The OS of training set. (B) Distribution of DPRS and OS of training set. Time-dependent ROC curves (C) and calibration curves (D) validation at 1, 2, and 3 years of prognostic value in TCGA cohort. (EH) Construction and validation of GEO external validation set (GSE85916). (E) The OS of validation set. (F) Distribution of DPRS and OS of validation set. Time-dependent ROC curves (G) and calibration curves (H) validation at 1, 2, and 3 years of prognostic value in GEO cohort.
Figure 7
Figure 7
Correlation of risk score with TMB and clinical characteristics (A) Comparison of TMB between two DDR subtypes. (B) The OS of patients in the high- and low-risk groups. (C) The OS of patients in the risk groups combined with the TMB groups. (D) Univariate Cox analysis and (E) multivariate Cox analysis of clinical characteristics. (F) Nomogram predicting OS for PAAD patients. Time-dependent ROC curves (G) and calibration curves (H) validation at 1, 2, and 3 years of prognostic value in nomogram. *** represents p < 0.001.
Figure 8
Figure 8
The boxplots and scatter plots of CTLA4 (A) and PDCD1 (B) in the low-and high-risk groups. (C) Boxplots showing estimated IC50 values for Olaparib, Niraparib, Berzosertib, AZD6738 and MK8776 in the TCGA-PAAD dataset (D) The uniform manifold approximation and projection (UMAP) plot demonstrates main cell types in PAAD. (E) The distribution of each type and DDR-based score expression in PAAD. (F) DDR-based scores in different cells are various (p < 0.05). (G) Staining scores of MET and ERAP2 were graded at four levels and two groups. Scale bar, 100 μm. (H) The OS of patients in the high and low expression of MET or ERAP2.

Similar articles

Cited by

References

    1. Siegel R.L., Miller K.D., Fuchs H.E., Jemal A. Cancer Statistics, 2021. CA Cancer J. Clin. 2021;71:7–33. doi: 10.3322/caac.21654. - DOI - PubMed
    1. Klein A.P. Pancreatic cancer epidemiology: Understanding the role of lifestyle and inherited risk factors. Nat. Rev. Gastroenterol. Hepatol. 2021;18:493–502. doi: 10.1038/s41575-021-00457-x. - DOI - PMC - PubMed
    1. Bailey P., Chang D.K., Nones K., Johns A.L., Patch A.-M., Gingras M.-C., Miller D.K., Christ A.N., Bruxner T.J.C., Quinn M.C., et al. Genomic analyses identify molecular subtypes of pancreatic cancer. Nature. 2016;531:47–52. doi: 10.1038/nature16965. - DOI - PubMed
    1. Collisson E.A., Sadanandam A., Olson P., Gibb W.J., Truitt M., Gu S., Cooc J., Weinkle J., Kim G.E., Jakkula L., et al. Subtypes of pancreatic ductal adenocarcinoma and their differing responses to therapy. Nat. Med. 2011;17:500–503. doi: 10.1038/nm.2344. - DOI - PMC - PubMed
    1. Moffitt R.A., Marayati R., Flate E.L., Volmar K.E., Loeza S.G.H., Hoadley K.A., Rashid N.U., Williams L.A., Eaton S.C., Chung A.H., et al. Virtual microdissection identifies distinct tumor- and stroma-specific subtypes of pancreatic ductal adenocarcinoma. Nat. Genet. 2015;47:1168–1178. doi: 10.1038/ng.3398. - DOI - PMC - PubMed

MeSH terms

Substances