. 2022 Sep 6;23(18):10256.
doi: 10.3390/ijms231810256.

Gut Microbiota Functional Traits, Blood pH, and Anti-GAD Antibodies Concur in the Clinical Characterization of T1D at Onset

Affiliations

Gut Microbiota Functional Traits, Blood pH, and Anti-GAD Antibodies Concur in the Clinical Characterization of T1D at Onset

Federica Del Chierico et al. Int J Mol Sci. .

Abstract

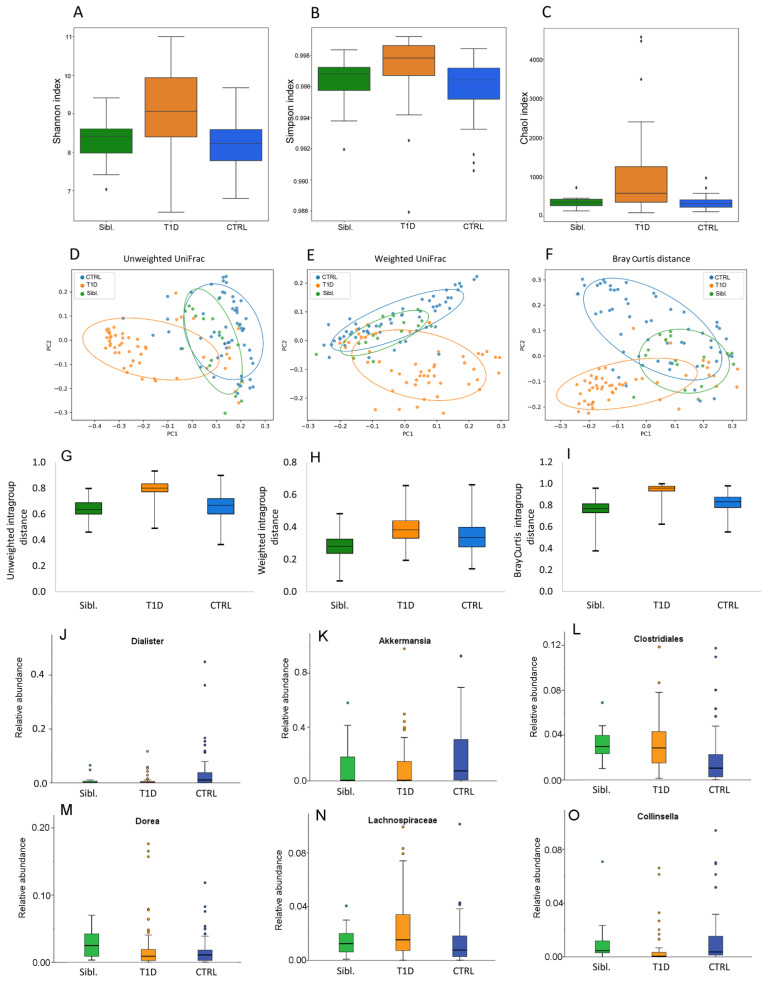
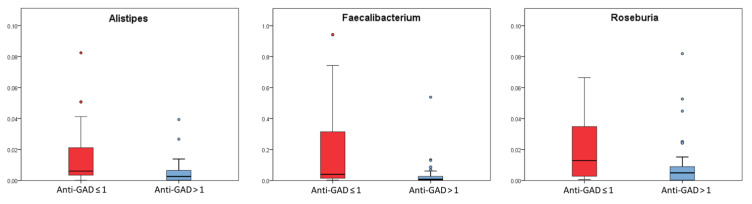
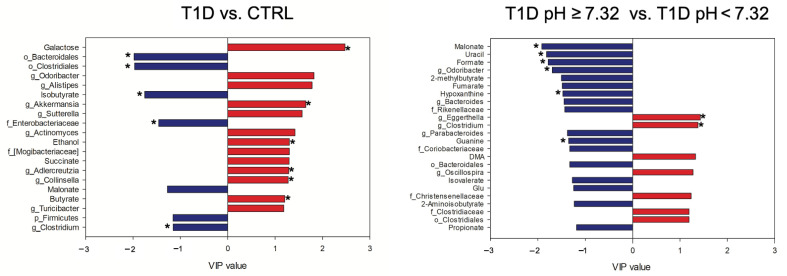
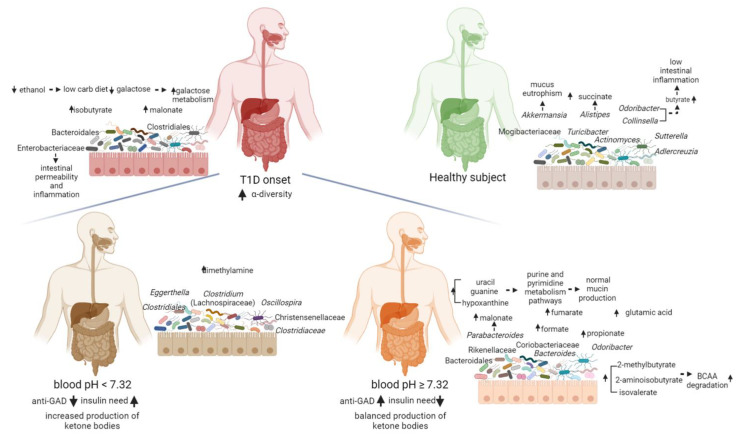
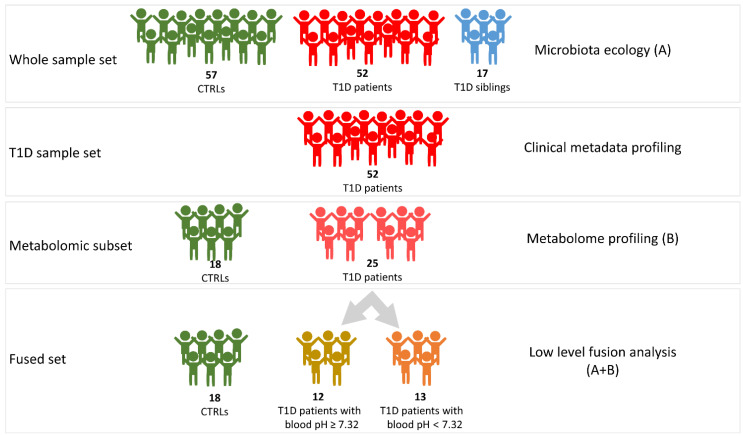
Alterations of gut microbiota have been identified before clinical manifestation of type 1 diabetes (T1D). To identify the associations amongst gut microbiome profile, metabolism and disease markers, the 16S rRNA-based microbiota profiling and 1H-NMR metabolomic analysis were performed on stool samples of 52 T1D patients at onset, 17 T1D siblings and 57 healthy subjects (CTRL). Univariate, multivariate analyses and classification models were applied to clinical and -omic integrated datasets. In T1D patients and their siblings, Clostridiales and Dorea were increased and Dialister and Akkermansia were decreased compared to CTRL, while in T1D, Lachnospiraceae were higher and Collinsella was lower, compared to siblings and CTRL. Higher levels of isobutyrate, malonate, Clostridium, Enterobacteriaceae, Clostridiales, Bacteroidales, were associated to T1D compared to CTRL. Patients with higher anti-GAD levels showed low abundances of Roseburia, Faecalibacterium and Alistipes and those with normal blood pH and low serum HbA1c levels showed high levels of purine and pyrimidine intermediates. We detected specific gut microbiota profiles linked to both T1D at the onset and to diabetes familiarity. The presence of specific microbial and metabolic profiles in gut linked to anti-GAD levels and to blood acidosis can be considered as predictive biomarker associated progression and severity of T1D.

Keywords: anti-GAD antibody; gut microbiota ecology and metabolome; insulin need; ketoacidosis; microbial biomarkers; omics data integration; pediatrics; type 1 diabetes (T1D).


Conflict of interest statement

The authors declare no conflict of interest.

Figures

Figure 1
Figure 1
Principal component analysis (PCA) loadings plot of T1D clinical data performed on the T1D overall cohort. PCA was applied to the entire matrix of variables composed of anti-GAD, IAA, IA2, HbA1c, cholesterol, exogenous insulin need, blood pH, age and c-peptide, after autoscaling. These variables were selected among all the clinical parameters for T1D in order to avoid information redundancy. PCA model showed the first principal component (PC1) accounted for 23% of the overall variance and the second principal component (PC2) accounted for 19%.
Figure 2
Figure 2
Gut microbiota ecology for siblings, T1D and CTRL groups. Panels (AC): α-diversity Shannon, Simpson and ChaoI indexes. Panels (DF): β-diversity PCoA plots of distance matrices calculated by unweighted UniFrac, weighted UniFrac and Bray Curtis algorithms. Panels (GI): intragroup distance calculated by unweighted UniFrac, weighted UniFrac and Bray Curtis algorithms. Panels (JO): Box plots showing the relative abundances of differentially abundant taxa based on a Kruskal–Wallis test (FDR p value < 0.1) amongst siblings (green box), T1D patients (orange box) and CTRL (blue box) groups. Box plots report median, minimum and maximum values, and the 25th and 75th percentile values of relative abundances of taxa.
Figure 3
Figure 3
Box plots of the taxa selected basing on Kruskal–Wallis test (p value ≤ 0.05) for patients stratified by anti-GAD ≤ 1 (red box) and anti-GAD > 1 (light blue box). Box plots report median, minimum and maximum values, and the 25th and 75th percentile values of relative abundances of taxa.
Figure 4
Figure 4
VIP values of the significant metabolites and bacterial taxa in the omics-data integration analysis. The levels of the features in blue are higher in T1D patients and in T1D pH ≥ 7.32, while the features in red are higher in CTRL and in T1D pH < 7.32. Features that resulted significative also at the univariate analysis were labeled with *. DMA, dimethylamine; Glu, glutamic acid.
Figure 5
Figure 5
Functional descriptive model of T1D gut microbiota at onset predicting the host–microbiota interaction. Blood pH and anti-GAD antibodies resulted to be good clinical biomarkers to characterize the gut microbiota specific and functional features at the onset of T1D. T1D patients were characterized by high levels of isobutyrate, malonate, Clostridium (Lachnospiraceae), Enterobacteriaceae, Bacteroidales and Clostridiales unk. families, while CTRL showed higher levels of butyrate, galactose, ethanol, succinate, Odoribacter, Alistipes, Akkermansia, Sutterella, Actinomyces, Adlercreutzia, Collinsella, Turicibacter and Mogibacteriaceae. T1D pH ≥ 7.32 patients showed high values of malonate, uracil, formate, 2-methylbutyrate, fumarate, hypoxanthine, guanine, isovalerate, propionate, 2-aminoisobutyrate and glutamic acid (Glu), Odoribacter, Bacteroides, Parabacteroides, Rikenellaceae, Coriobacteriaceae and Bacteroidales. In T1D pH < 7.32 patients were higher levels of dimethylamine (DMA), Eggerthella, Clostridium (Lachnospiraceae), Oscillospira, Christensenellaceae, Clostridiaceae and Clostridiales. Created with BioRender.com.
Figure 6
Figure 6
Graphic representation of the workflow of omics analyses. A, microbiota ecology outcome; B, metabolome profiling outcome. A + B, integration of metabolomic and metagenomic results.

Similar articles

Cited by

References

    1. Atkinson M.A., Eisenbarth G.S., Michels A.W. Type 1 Diabetes. Lancet. 2014;383:69–82. doi: 10.1016/S0140-6736(13)60591-7. - DOI - PMC - PubMed
    1. American Diabetes Association Standards of Medical Care in Diabetes—2013. Diabetes Care. 2013;36:S11–S66. doi: 10.2337/dc13-S011. - DOI - PMC - PubMed
    1. American Diabetes Association Diagnosis and Classification of Diabetes Mellitus. Diabetes Care. 2010;33:S62–S69. doi: 10.2337/dc10-S062. - DOI - PMC - PubMed
    1. Castellanos L., Tuffaha M., Koren D., Levitsky L.L. Management of Diabetic Ketoacidosis in Children and Adolescents with Type 1 Diabetes Mellitus. Pediatr. Drugs. 2020;22:357–367. doi: 10.1007/s40272-020-00397-0. - DOI - PubMed
    1. Stentz F.B., Umpierrez G.E., Cuervo R., Kitabchi A.E. Proinflammatory Cytokines, Markers of Cardiovascular Risks, Oxidative Stress, and Lipid Peroxidation in Patients With Hyperglycemic Crises. Diabetes. 2004;53:2079–2086. doi: 10.2337/diabetes.53.8.2079. - DOI - PubMed