. 2022 Sep 7;23(18):10307.
doi: 10.3390/ijms231810307.

Progesterone Receptor Modulates Extraembryonic Mesoderm and Cardiac Progenitor Specification during Mouse Gastrulation

Affiliations

Progesterone Receptor Modulates Extraembryonic Mesoderm and Cardiac Progenitor Specification during Mouse Gastrulation

Anna Maria Drozd et al. Int J Mol Sci. .

Abstract

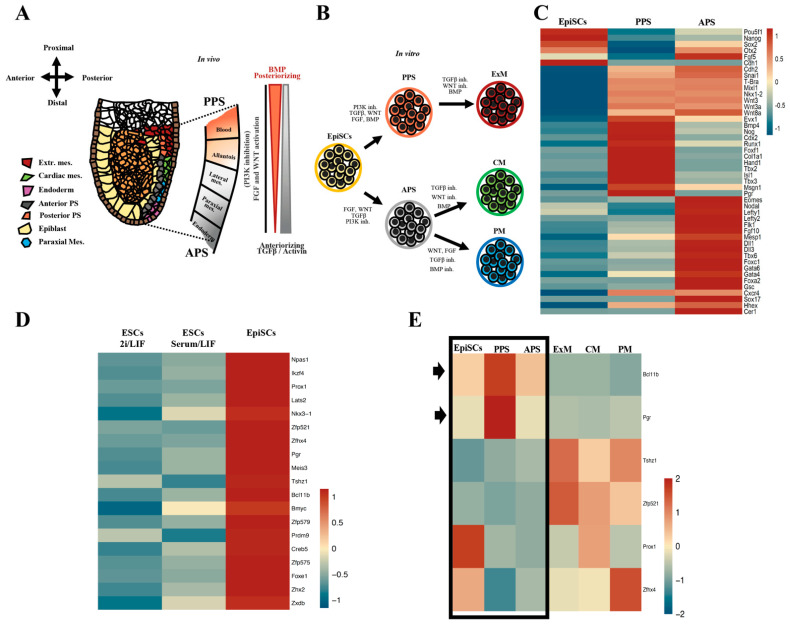
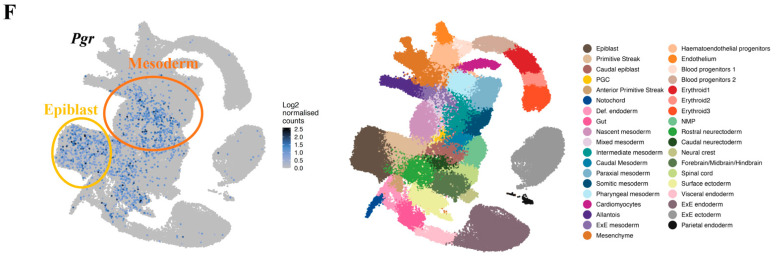
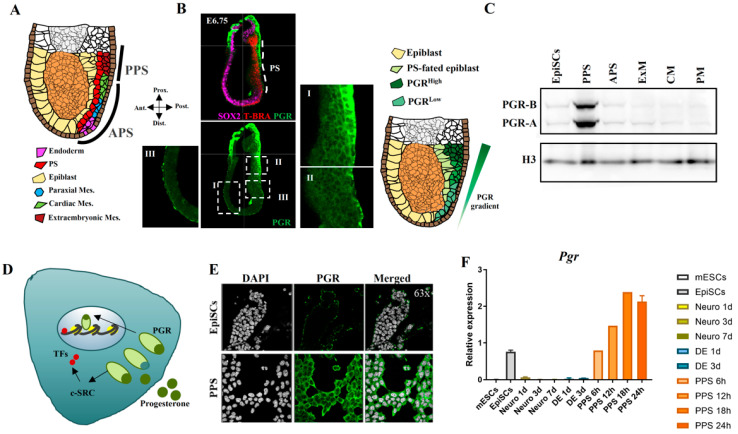
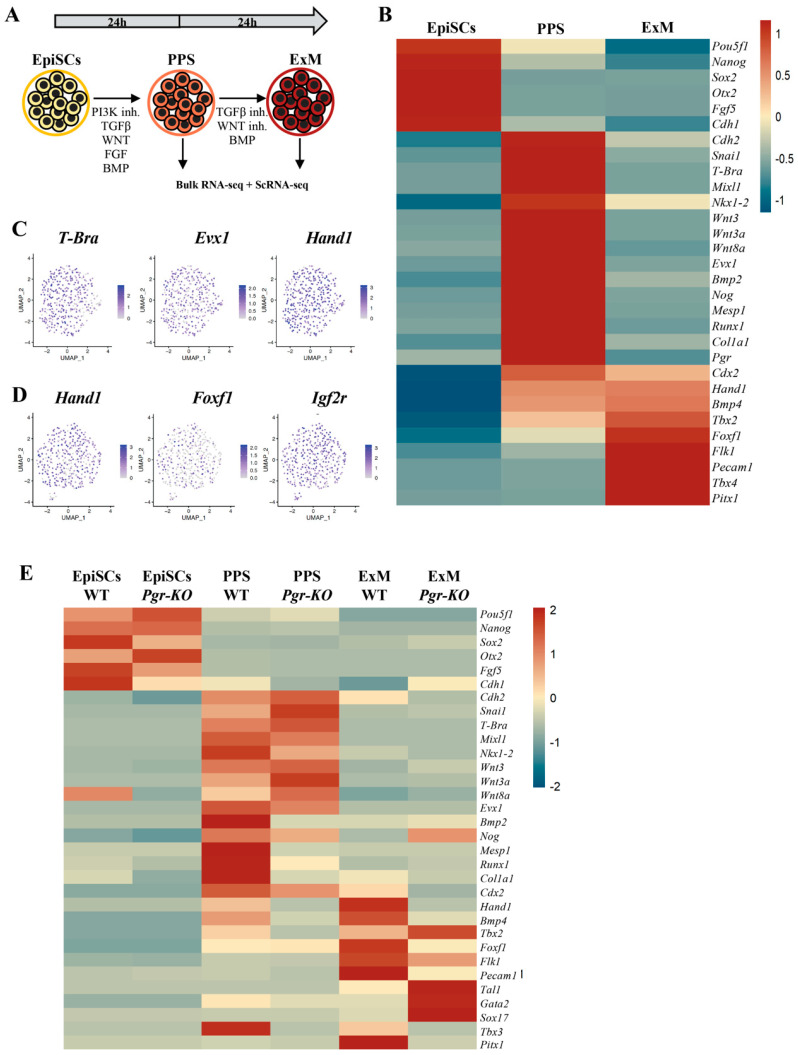
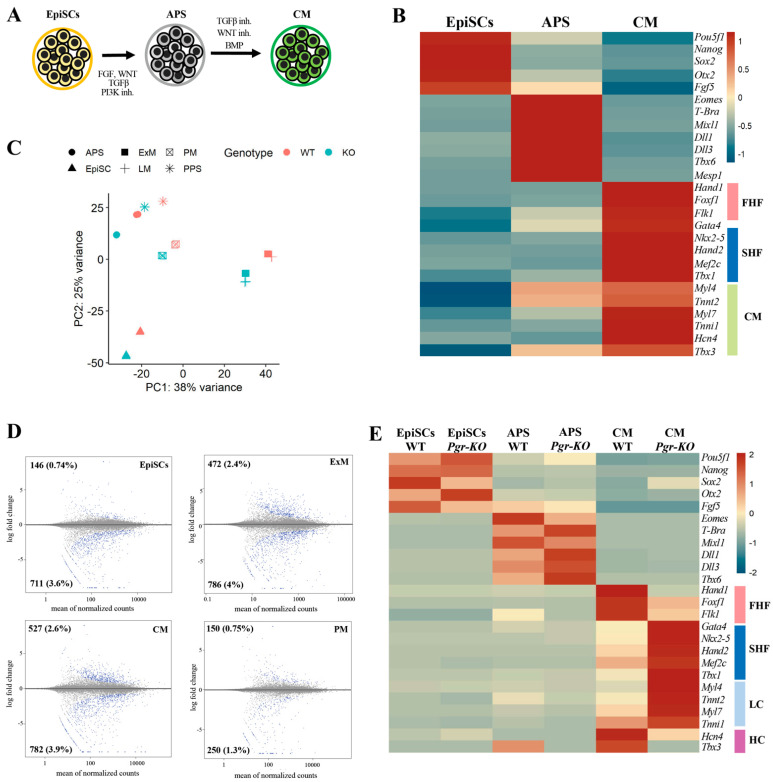
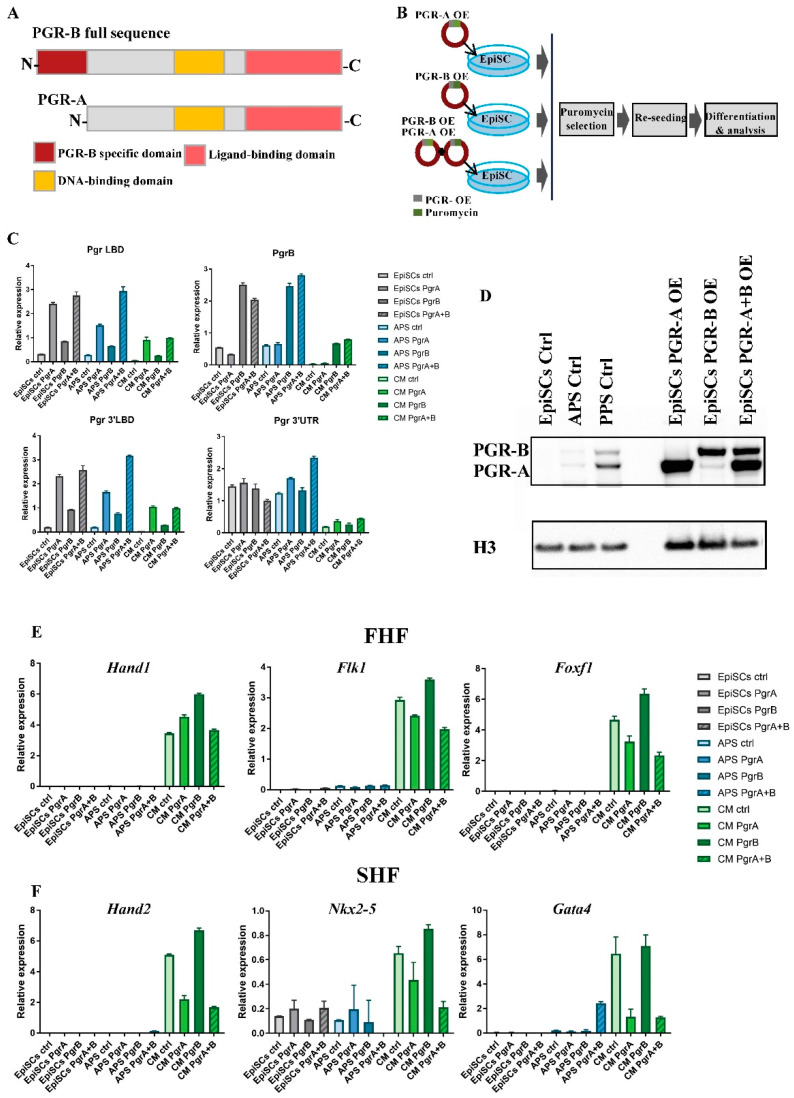
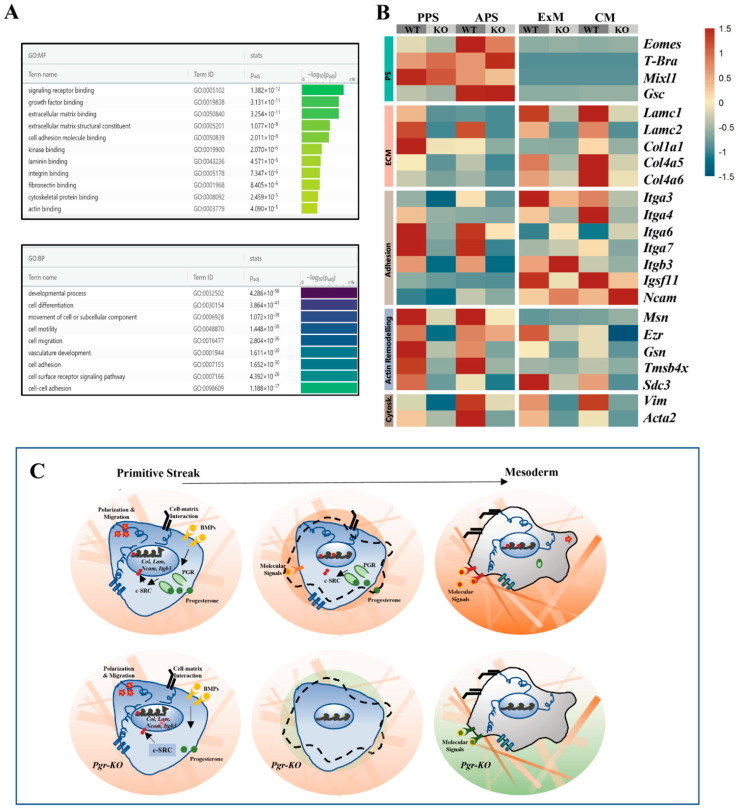
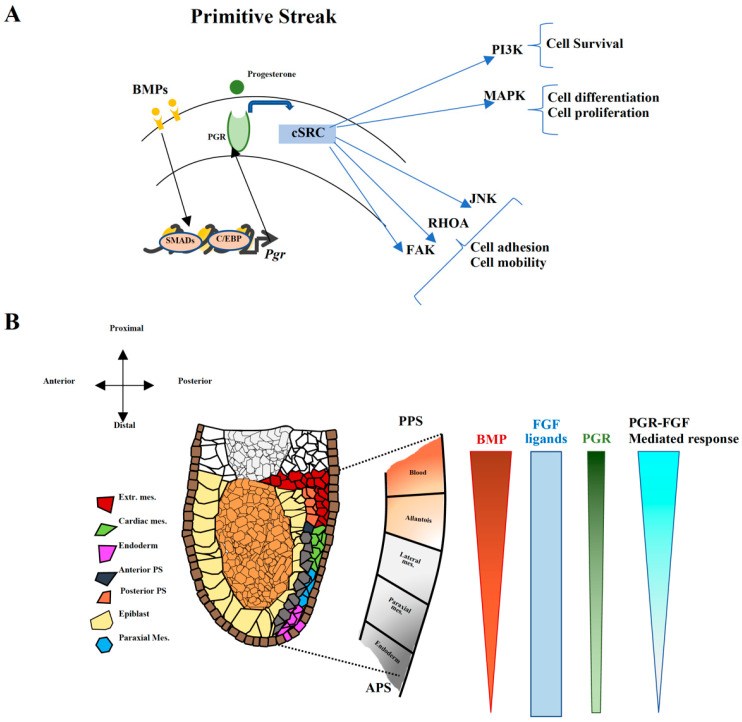
Progesterone treatment is commonly employed to promote and support pregnancy. While maternal tissues are the main progesterone targets in humans and mice, its receptor (PGR) is expressed in the murine embryo, questioning its function during embryonic development. Progesterone has been previously associated with murine blastocyst development. Whether it contributes to lineage specification is largely unknown. Gastrulation initiates lineage specification and generation of the progenitors contributing to all organs. Cells passing through the primitive streak (PS) will give rise to the mesoderm and endoderm. Cells emerging posteriorly will form the extraembryonic mesodermal tissues supporting embryonic growth. Cells arising anteriorly will contribute to the embryonic heart in two sets of distinct progenitors, first (FHF) and second heart field (SHF). We found that PGR is expressed in a posterior-anterior gradient in the PS of gastrulating embryos. We established in vitro differentiation systems inducing posterior (extraembryonic) and anterior (cardiac) mesoderm to unravel PGR function. We discovered that PGR specifically modulates extraembryonic and cardiac mesoderm. Overexpression experiments revealed that PGR safeguards cardiac differentiation, blocking premature SHF progenitor specification and sustaining the FHF progenitor pool. This role of PGR in heart development indicates that progesterone administration should be closely monitored in potential early-pregnancy patients undergoing infertility treatment.

Keywords: ECM; cardiac differentiation; cell adhesion; epiblast stem cells; extraembryonic mesoderm; mesoderm induction; mouse gastrulation; progesterone receptor.


Conflict of interest statement

The authors declare no conflict of interest.

Figures

Figure 1
Figure 1
Identification of PGR as a TF candidate involved in priming EpiSCs towards mesoderm fate. (A) Schematic representation of E6.5–7.0 gastrulating mouse embryo. Epiblast cells (yellow) ingress and become the posterior (PPS, light red) and/or anterior (APS, grey) primitive streak (PS). Cells originating in different regions of the PS display distinct mesodermal fate bias. Extraembryonic mesoderm (dark red) including blood (hemangioblast) and allantois originate from PPS, while APS will give rise to cardiac mesoderm (green), paraxial mesoderm (blue), and definitive endoderm (pink). The coordinated activity of different signaling pathways (NODAL, WNT, and BMP) activate specific transcriptional programs that direct mesodermal fate. (B) Illustration summarizing the protocol used to differentiate EpiSCs towards PPS and APS cells and their derivatives, cardiac mesoderm (CM) and paraxial mesoderm (PM) progenitors. (C) Heatmap of RNA-Seq of EpiSCs, PPS, and APS delineating the antero-posterior identity of the in vitro-generated cell populations. PPS cells are enriched in extraembryonic markers and known BMP target genes (Evx1, Bmp4, Hand1, Foxf1, and Tbx3), while APS cells show high levels of anterior PS markers (Gsc, Sox17, Tbx6, Eomes, and Foxa2). (D) Identification of 19 TFs specifically enriched in EpiSCs by comparing RNA-Seq data of EpiSCs with mouse ESCs cultured in 2i/LIF and serum/LIF. (E) Heatmap showing the expression of the six short-listed TFs in different cell types. Blc11b and Pgr exhibit a distinct pattern of expression, with the highest levels of mRNA found in EpiSCs, PPS, and APS (highlighted by arrows), (RNA-Seq, p ≤ 0.05, fold-change ≥ 1.5). ESC, embryonic stem cells; EpiSC, epiblast stem cells; PPS, posterior primitive streak; APS, anterior primitive streak; ExM, extraembryonic mesoderm; CM, cardiac mesoderm; PM, paraxial mesoderm. (F) UMAP visualization and clustering of scRNA-Seq of gastrulating mouse embryos showing Pgr expression in the epiblast (yellow circle) and mesoderm (brown circle) (data set obtained from Pijuan-Sala et al. Nature 2019 [21]).
Figure 1
Figure 1
Identification of PGR as a TF candidate involved in priming EpiSCs towards mesoderm fate. (A) Schematic representation of E6.5–7.0 gastrulating mouse embryo. Epiblast cells (yellow) ingress and become the posterior (PPS, light red) and/or anterior (APS, grey) primitive streak (PS). Cells originating in different regions of the PS display distinct mesodermal fate bias. Extraembryonic mesoderm (dark red) including blood (hemangioblast) and allantois originate from PPS, while APS will give rise to cardiac mesoderm (green), paraxial mesoderm (blue), and definitive endoderm (pink). The coordinated activity of different signaling pathways (NODAL, WNT, and BMP) activate specific transcriptional programs that direct mesodermal fate. (B) Illustration summarizing the protocol used to differentiate EpiSCs towards PPS and APS cells and their derivatives, cardiac mesoderm (CM) and paraxial mesoderm (PM) progenitors. (C) Heatmap of RNA-Seq of EpiSCs, PPS, and APS delineating the antero-posterior identity of the in vitro-generated cell populations. PPS cells are enriched in extraembryonic markers and known BMP target genes (Evx1, Bmp4, Hand1, Foxf1, and Tbx3), while APS cells show high levels of anterior PS markers (Gsc, Sox17, Tbx6, Eomes, and Foxa2). (D) Identification of 19 TFs specifically enriched in EpiSCs by comparing RNA-Seq data of EpiSCs with mouse ESCs cultured in 2i/LIF and serum/LIF. (E) Heatmap showing the expression of the six short-listed TFs in different cell types. Blc11b and Pgr exhibit a distinct pattern of expression, with the highest levels of mRNA found in EpiSCs, PPS, and APS (highlighted by arrows), (RNA-Seq, p ≤ 0.05, fold-change ≥ 1.5). ESC, embryonic stem cells; EpiSC, epiblast stem cells; PPS, posterior primitive streak; APS, anterior primitive streak; ExM, extraembryonic mesoderm; CM, cardiac mesoderm; PM, paraxial mesoderm. (F) UMAP visualization and clustering of scRNA-Seq of gastrulating mouse embryos showing Pgr expression in the epiblast (yellow circle) and mesoderm (brown circle) (data set obtained from Pijuan-Sala et al. Nature 2019 [21]).
Figure 2
Figure 2
Pgr is expressed in primitive streak cells in vivo and in vitro. (A) Illustration depicting E6.5-E7.0 gastrulating embryo and indicating posterior primitive streak (PPS), anterior primitive streak (APS), and their derivatives. Endoderm (pink), primitive streak (red), epiblast (yellow), paraxial mesoderm (blue), cardiac mesoderm (green), and extraembryonic mesoderm (dark red). (B) Confocal images of E6.75 embryos probed with T-BRA (red), SOX2 (magenta) and PGR (green) antibodies reveal a gradient of PGR with higher levels in PPS. Panel I shows high levels of PGR in the PPS, panel II demonstrates low levels of PGR in the APS, while in panel III the complete absence of PGR in the most anterior part of the embryo. The schematic on the right depicts the PGR gradient (green) in the posterior and anterior PS. Images were taken using 40× objective. (C) Western blot assay confirming that PGR protein levels follow the same pattern as mRNA during mesoderm induction, with the highest protein concentration in PPS cells compared with EpiSCs, APS, ExM, CM, and PM. Histone H3 (H3) is used as loading control. (D) Illustration depicting the dual PGR activity as a ligand-dependent TF (nuclear localization) and modulator of signaling pathways (cytoplasmatic localization) with the previously described interaction with c-SRC [24]. (E) Immunofluorescence showing PGR localization in EpiSCs and PPS. In the EpiSCs, low levels of PGR are detected. In PPS, PGR protein is localized mainly in the cytoplasm with a smaller percentage present in the nucleus. Images were taken using 63× objective. (F) RT-qPCR analysis of Pgr expression across different cell lineages. Pgr transcript is specifically expressed in EpiSCs and PPS. Time course induction of PPS shows the highest expression at 18 h of differentiation.
Figure 3
Figure 3
Pgr modulates PPS induction and extraembryonic mesoderm (ExM) formation. (A) Schematic illustration of the extraembryonic differentiation protocol. EpiSCs are initially subjected to PPS induction, and thereafter exposed to BMP for additional 24 h to induce ExM differentiation. High levels of BMP restrict PS cells towards extraembryonic mesoderm-like fate. (B) Heatmap displaying relative expression of selected differentially regulated genes in EpiSCs, PPS, and ExM (RNA-Seq, p ≤ 0.05, fold-change ≥ 1.5). (C) UMAP plots showing gene expression distribution in PPS cells. Individual cells are colored by expression of key posterior primitive streak markers (T-Bra, Exv1, and Hand1). (D) UMAP plots showing gene expression distribution in ExM. Individual cells are colored by the expression of key extraembryonic mesoderm marker genes (Hand1, Foxf1, and Igrf2). (E) Differential expression analysis of WT and Pgr-KO EpiSCs differentiated towards PPS and ExM revealing downregulation of PPS markers (Hand1, Col1a1, and Bmp2) and a stronger effect in ExM (Hand1, Foxf1, Pecam1, Flk1, and Bmp4). Upregulation of Tal1, Gata2, and Sox17 in Pgr-KO indicates a shift of ExM towards a hemangioblast fate (RNA-Seq, p ≤ 0.05, fold-change ≥ 1.5).
Figure 4
Figure 4
PGR differentially regulates FHF and SHF cardiac progenitors. (A) Schematic illustration of the cardiac mesoderm (CM) differentiation protocol. EpiSCs are initially subjected to APS induction, and thereafter exposed to BMP for 24 h to induce CM differentiation. (B) Heatmap displaying relative expression of selected differentially regulated genes in EpiSCs, APS, and CM (RNA-Seq, p ≤ 0.05, fold-change ≥ 1.5). (C) PCA plots clustering WT and Pgr-KO cells subjected to differentiation conditions: EpiSCs, PPS, APS, extraembryonic mesoderm (ExM), cardiac mesoderm (CM), and paraxial mesoderm (PM). CM and ExM are affected to a higher extent by Pgr depletion. (D) MA plots of WT and Pgr-KO comparisons in EpiSCs, ExM, CM, and PM showing the highest number of differentially expressed genes in CM and ExM. Blue dots indicate differentially expressed genes with p ≤ 0.05, fold-change ≥ 1.5 (E) Differential expression analysis of WT and Pgr-KO EpiSCs differentiated towards APS and CM, showing modest effects of loss of Pgr on APS induction, but stronger consequences within CM differentiation. In CM, the FHF cardiac markers (Hand1, Flk1, and Foxf1) are downregulated, while the SHF markers (Gata4, Nkx2-5, Hand2, Mef2, and Tbx1) are upregulated, revealing a propension of Pgr-KO cells to acquire a cardio-pharyngeal fate. First heart field (FHF, ligh pink), second heart field (SHF, blue), late cardiomyocytes (LC, light blue), and heart conductive (HC) makers (pink).
Figure 5
Figure 5
PRG-B and PGR-A selectively regulate FHF vs. SHF cardiac differentiation. (A) Illustration depicting PGR protein structure. The long form of PGR, PGR-B, includes the PGR-B-specific domain (dark red), the DNA-binding domain (yellow), and the ligand-binding domain (light red). The short form of PGR lacks the N-terminal PRG-B domain. (B) Schematic of the overexpression assay. The sequences of both full-length PGR-B and shorter PGR-A were cloned into a lentiviral vector under the EF1α promoter. After transduction, cells undergo puromycin selection and differentiation. (C) Relative mRNA expression of Pgr isoforms measured by RT-qPCR along differentiation of EpiSCs to APS and CM, confirming overexpression of transduced PGR. (D) Western blot showing the levels of overexpressed (OE) PGR isoforms in EpiSCs. Overexpression of specific isoforms is higher than the endogenous levels in EpiSC, APS, and PPS. (E) RT-qPCR analyses of cells overexpressing PGR isoforms showing mild upregulation of the FHF signature Hand1, Flk1, and Foxf1 due to PGR-B overexpression. (F) RT-qPCR analyses indicate decreased levels for the SHF signature markers (Hand2, Nkx2-5, and Gata4) by overexpressing PGR-A isoform.
Figure 6
Figure 6
PGR influences cell-ECM, cell-cell interactions and cytoskeletal remodeling of mesoderm progenitors. (A) GO-term enrichment analysis of genes differentially expressed in WT and Pgr-KO PPS displays significant overrepresentation of terms associated with ECM interactions, cell adhesion, and cytoskeletal protein binding (Fisher’s exact test with Bonferroni correction). (B) Heatmap indicating downregulation of Laminins, Collagens, and actin remodeling transcripts in APS and PPS with moderate changes in the PS signature genes. In ExM and CM, adhesion and ECM genes are downregulated in Pgr-KO, with the exception of Itgb3, which is specifically upregulated in the ExM and Ncam1, which is upregulated in CM. (C) PGR-KO cells show altered expression of genes related to cellular adhesion, cytoskeleton remodeling, and ECM composition. Changes in the cellular interactions with the direct environment alter the differentiation program and affect the balanced production of mesoderm types.
Figure 7
Figure 7
BMP-induced PGR expression fine-tunes and amplifies FGF response during cell specification. (A) Illustration showing a proposed molecular mechanism of PGR function during differentiation. As described previously, BMP induces PGR upregulation [50]. PGR, in turn, interacts with c-SRC [24] and activates its downstream targets: PI3K, MAPK, JNK, RHOA and FAK, thus influencing cell survival, differentiation, proliferation, adhesion, and motility. (B) Illustration depicting ligand gradients described in the gastrulating mouse embryo at around E6.5 with BMP expressed in posterior–anterior gradient and modulating the expression of PGR along the same axis. We propose that this PGR gradient establishes a gradient for FGF response in the early mouse embryo, as shown in A, thus influencing cell fate decisions during mesoderm development, specifically ExM and CM specification.

Similar articles

Cited by

References

    1. Li R., Wang X., Huang Z., Balaji J., Kim T.H., Wang T., Zhou L., Deleon A., Cook M.E., Marbrey M.W., et al. The role of epithelial progesterone receptor isoforms in embryo implantation. iScience. 2021;24:103487. doi: 10.1016/j.isci.2021.103487. - DOI - PMC - PubMed
    1. Graham J.D., Clarke C.L. Physiological Action of Progesterone in Target Tissues. Endocr. Rev. 1997;18:502–519. doi: 10.1210/edrv.18.4.0308. - DOI - PubMed
    1. Olbrich L., Wessel L., Balakrishnan-Renuka A., Böing M., Brand-Saberi B., Theiss C. Rapid Impact of Progesterone on the Neuronal Growth Cone. Endocrinology. 2013;154:3784–3795. doi: 10.1210/en.2013-1175. - DOI - PubMed
    1. Sim C.B., Phipson B., Ziemann M., Rafehi H., Mills R.J., Watt K.I., Abu-Bonsrah K.D., Kalathur R.K., Voges H.K., Dinh D.T., et al. Sex-Specific Control of Human Heart Maturation by the Progesterone Receptor. Circulation. 2021;143:1614–1628. doi: 10.1161/CIRCULATIONAHA.120.051921. - DOI - PMC - PubMed
    1. Kot A., Zhong Z.A., Zhang H.L., Lay Y.-A.E., ELane N., Yao W. Sex dimorphic regulation of osteoprogenitor progesterone in bone stromal cells. J. Mol. Endocrinol. 2017;59:351–363. doi: 10.1530/JME-17-0076. - DOI - PMC - PubMed

LinkOut - more resources