

Senescence-Independent Anti-Inflammatory Activity of the Senolytic Drugs Dasatinib, Navitoclax, and Venetoclax in Zebrafish Models of Chronic Inflammation
- PMID: 36142384
- PMCID: PMC9499634
- DOI: 10.3390/ijms231810468
Senescence-Independent Anti-Inflammatory Activity of the Senolytic Drugs Dasatinib, Navitoclax, and Venetoclax in Zebrafish Models of Chronic Inflammation
Abstract
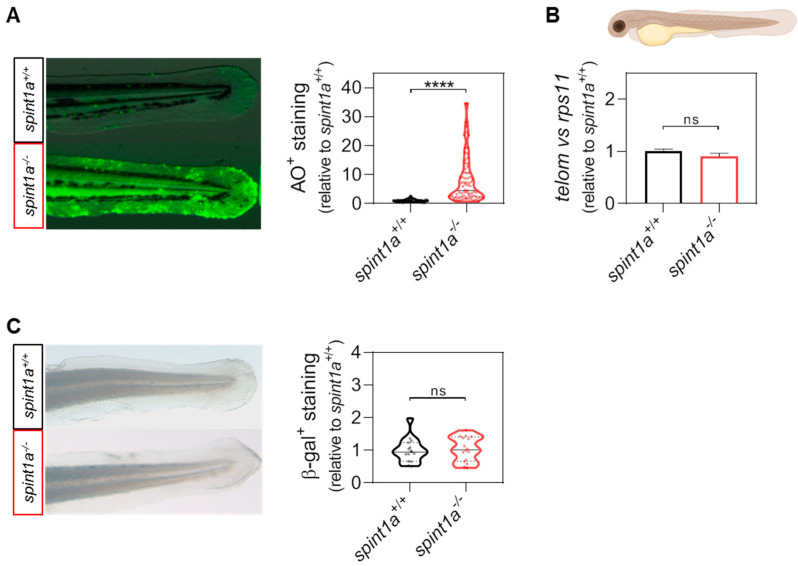
Telomere shortening is the main molecular mechanism of aging, but not the only one. The adaptive immune system also ages, and older organisms tend to develop a chronic pro-inflammatory status with low-grade inflammation characterized by chronic activation of the innate immune system, called inflammaging. One of the main stimuli that fuels inflammaging is a high nutrient intake, triggering a metabolic inflammation process called metainflammation. In this study, we report the anti-inflammatory activity of several senolytic drugs in the context of chronic inflammation, by using two different zebrafish models: (i) a chronic skin inflammation model with a hypomorphic mutation in spint1a, the gene encoding the serine protease inhibitor, kunitz-type, 1a (also known as hai1a) and (ii) a non-alcoholic fatty liver disease/non-alcoholic steatohepatitis (NAFLD/NASH) model with inflammation induced by a high-fat diet. Our results show that, although these models do not manifest premature aging, the senolytic drugs dasatinib, navitoclax, and venetoclax have an anti-inflammatory effect that results in the amelioration of chronic inflammation.
Keywords: aging; chronic inflammation; metainflammation; senolytics; zebrafish.
Conflict of interest statement
The authors declare no conflict of interest. The funders had no role in the design of the study; in the collection, analyses, or interpretation of data; in the writing of the manuscript; or in the decision to publish the results.
Figures


Similar articles
-
Impact of Senolytic Treatment on Gene Expression in Aged Lung.Int J Mol Sci. 2023 Apr 21;24(8):7628. doi: 10.3390/ijms24087628. Int J Mol Sci. 2023. PMID: 37108795 Free PMC article.
-
Senolytic drugs, dasatinib and quercetin, attenuate adipose tissue inflammation, and ameliorate metabolic function in old age.Aging Cell. 2023 Feb;22(2):e13767. doi: 10.1111/acel.13767. Epub 2023 Jan 13. Aging Cell. 2023. PMID: 36637079 Free PMC article.
-
The Differential Effect of Senolytics on SASP Cytokine Secretion and Regulation of EMT by CAFs.Int J Mol Sci. 2024 Apr 4;25(7):4031. doi: 10.3390/ijms25074031. Int J Mol Sci. 2024. PMID: 38612842 Free PMC article.
-
Pharmacological Targeting of Senescence with Senolytics as a New Therapeutic Strategy for Neurodegeneration.Mol Pharmacol. 2024 Jan 10;105(2):64-74. doi: 10.1124/molpharm.123.000803. Mol Pharmacol. 2024. PMID: 38164616 Review.
-
A study of the molecular mechanism of quercetin and dasatinib combination as senolytic in alleviating age-related and kidney diseases.J Food Biochem. 2022 Dec;46(12):e14471. doi: 10.1111/jfbc.14471. Epub 2022 Oct 21. J Food Biochem. 2022. PMID: 36268851 Review.
Cited by
-
Development of a Short Telomere Zebrafish Model for Accelerated Aging Research and Antiaging Drug Screening.Aging Cell. 2025 Jun;24(6):e70007. doi: 10.1111/acel.70007. Epub 2025 Feb 8. Aging Cell. 2025. PMID: 39921881 Free PMC article.
-
Eternal Youth: A Comprehensive Exploration of Gene, Cellular, and Pharmacological Anti-Aging Strategies.Int J Mol Sci. 2024 Jan 4;25(1):643. doi: 10.3390/ijms25010643. Int J Mol Sci. 2024. PMID: 38203812 Free PMC article. Review.
-
Immunomodulatory Activity of the Tyrosine Kinase Inhibitor Dasatinib to Elicit NK Cytotoxicity against Cancer, HIV Infection and Aging.Pharmaceutics. 2023 Mar 11;15(3):917. doi: 10.3390/pharmaceutics15030917. Pharmaceutics. 2023. PMID: 36986778 Free PMC article. Review.
-
Adipose tissue as a linchpin of organismal ageing.Nat Metab. 2024 May;6(5):793-807. doi: 10.1038/s42255-024-01046-3. Epub 2024 May 23. Nat Metab. 2024. PMID: 38783156 Free PMC article. Review.
-
Senescent macrophages in cancer: roles in tumor progression and treatment opportunities.Cancer Biol Med. 2025 May 6;22(5):439-59. doi: 10.20892/j.issn.2095-3941.2024.0589. Cancer Biol Med. 2025. PMID: 40329498 Free PMC article. Review.
References
MeSH terms
Substances
Grants and funding
LinkOut - more resources
Full Text Sources
Other Literature Sources
Medical
Molecular Biology Databases
