

Overexpression of a Fragaria vesca MYB Transcription Factor Gene (FvMYB82) Increases Salt and Cold Tolerance in Arabidopsis thaliana
- PMID: 36142448
- PMCID: PMC9503638
- DOI: 10.3390/ijms231810538
Overexpression of a Fragaria vesca MYB Transcription Factor Gene (FvMYB82) Increases Salt and Cold Tolerance in Arabidopsis thaliana
Abstract
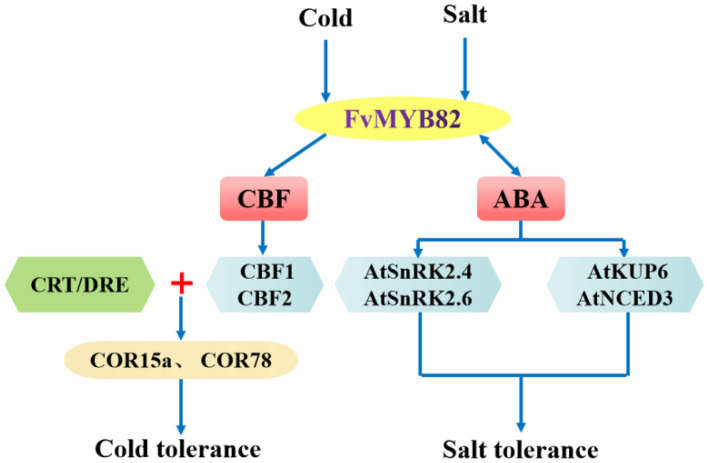
The MYB transcription factor (TF) family is one of the largest transcription families in plants, which is widely involved in the responses to different abiotic stresses, such as salt, cold, and drought. In the present study, a new MYB TF gene was cloned from Fragaria vesca (a diploid strawberry) and named FvMYB82. The open reading frame (ORF) of FvMYB82 was found to be 960 bp, encoding 319 amino acids. Sequence alignment results and predictions of the protein structure indicated that the FvMYB82 contained the conserved R2R3-MYB domain. Subcellular localization analysis showed that FvMYB82 was localized onto the nucleus. Furthermore, the qPCR showed that the expression level of FvMYB82 was higher in new leaves and roots than in mature leaves and stems. When dealing with different stresses, the expression level of FvMYB82 in F. vesca seedlings changed markedly, especially for salt and cold stress. When FvMYB82 was introduced into Arabidopsis thaliana, the tolerances to salt and cold stress of FvMYB82-OE A. thaliana were greatly improved. When dealt with salt and cold treatments, compared with wild-type and unloaded line (UL) A. thaliana, the transgenic lines had higher contents of proline and chlorophyll, as well as higher activities of superoxide dismutase (SOD), peroxidase (POD), and catalase (CAT). However, the transgenic A. thaliana had lower level of malondialdehyde (MDA) and electrolytic leakage (EL) than wild-type and UL A. thaliana under salt and cold stress. Meanwhile, FvMYB82 can also regulate the expression of downstream genes associated with salt stress (AtSnRK2.4, AtSnRK2.6, AtKUP6, and AtNCED3) and cold stress (AtCBF1, AtCBF2, AtCOR15a, and AtCOR78). Therefore, these results indicated that FvMYB82 probably plays an important role in the response to salt and cold stresses in A. thaliana by regulating downstream related genes.
Keywords: Fragaria vesca; FvMYB82; abiotic stress; low-temperature stress; salt stress.
Conflict of interest statement
The authors declare no conflict of interest.
Figures


Similar articles
-
Overexpression of a Fragaria vesca NAM, ATAF, and CUC (NAC) Transcription Factor Gene (FvNAC29) Increases Salt and Cold Tolerance in Arabidopsis thaliana.Int J Mol Sci. 2024 Apr 6;25(7):4088. doi: 10.3390/ijms25074088. Int J Mol Sci. 2024. PMID: 38612898 Free PMC article.
-
Overexpression of a Fragaria vesca 1R-MYB Transcription Factor Gene (FvMYB114) Increases Salt and Cold Tolerance in Arabidopsis thaliana.Int J Mol Sci. 2023 Mar 9;24(6):5261. doi: 10.3390/ijms24065261. Int J Mol Sci. 2023. PMID: 36982335 Free PMC article.
-
Molecular Cloning and Characterization of MbMYB108, a Malus baccata MYB Transcription Factor Gene, with Functions in Tolerance to Cold and Drought Stress in Transgenic Arabidopsis thaliana.Int J Mol Sci. 2022 Apr 27;23(9):4846. doi: 10.3390/ijms23094846. Int J Mol Sci. 2022. PMID: 35563237 Free PMC article.
-
Research advances of MYB transcription factors in plant stress resistance and breeding.Plant Signal Behav. 2019;14(8):1613131. doi: 10.1080/15592324.2019.1613131. Epub 2019 May 14. Plant Signal Behav. 2019. PMID: 31084451 Free PMC article. Review.
-
MYB Transcription Factors Becoming Mainstream in Plant Roots.Int J Mol Sci. 2022 Aug 17;23(16):9262. doi: 10.3390/ijms23169262. Int J Mol Sci. 2022. PMID: 36012533 Free PMC article. Review.
Cited by
-
Genome-Wide Identification, Characterization, and Expression Analysis of the MYB-R2R3 Gene Family in Black Pepper (Piper nigrum L.).Int J Mol Sci. 2024 Sep 12;25(18):9851. doi: 10.3390/ijms25189851. Int J Mol Sci. 2024. PMID: 39337340 Free PMC article.
-
Overexpression of a 'Paulownia fortunei' MYB Factor Gene, PfMYB44, Increases Salt and Drought Tolerance in Arabidopsis thaliana.Plants (Basel). 2024 Aug 15;13(16):2264. doi: 10.3390/plants13162264. Plants (Basel). 2024. PMID: 39204700 Free PMC article.
-
Overexpression of a Fragaria vesca NAM, ATAF, and CUC (NAC) Transcription Factor Gene (FvNAC29) Increases Salt and Cold Tolerance in Arabidopsis thaliana.Int J Mol Sci. 2024 Apr 6;25(7):4088. doi: 10.3390/ijms25074088. Int J Mol Sci. 2024. PMID: 38612898 Free PMC article.
-
Heterologous Expression of a Potential 'Paulownia fortunei' MYB Factor Gene, PfMYB90, Improves Salt and Cold Tolerance in Arabidopsis.Plants (Basel). 2024 Dec 25;14(1):24. doi: 10.3390/plants14010024. Plants (Basel). 2024. PMID: 39795283 Free PMC article.
-
Effect of membrane rigidification on the BrAFP1 expression and cold-tolerance in Brassica rapa.Front Plant Sci. 2025 Aug 13;16:1527754. doi: 10.3389/fpls.2025.1527754. eCollection 2025. Front Plant Sci. 2025. PMID: 40880867 Free PMC article.
References
MeSH terms
Substances
Grants and funding
LinkOut - more resources
Full Text Sources
Miscellaneous
