. 2022 Sep 11;23(18):10545.
doi: 10.3390/ijms231810545.

Vesicular Glutamate Release from Feeder-FreehiPSC-Derived Neurons

Affiliations

Vesicular Glutamate Release from Feeder-FreehiPSC-Derived Neurons

Simona Baldassari et al. Int J Mol Sci. .

Abstract

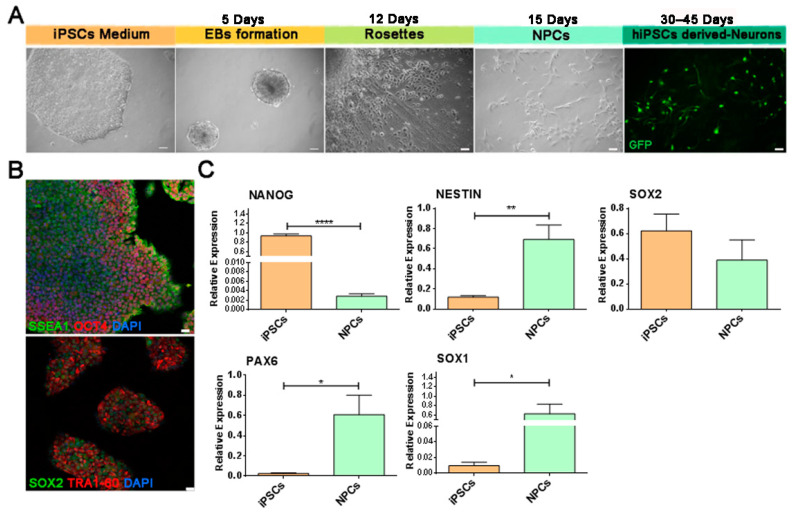
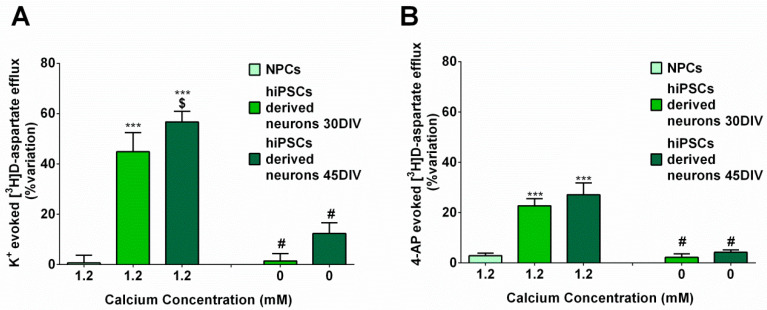
Human-induced pluripotent stem cells (hiPSCs) represent one of the main and powerful tools for the in vitro modeling of neurological diseases. Standard hiPSC-based protocols make use of animal-derived feeder systems to better support the neuronal differentiation process. Despite their efficiency, such protocols may not be appropriate to dissect neuronal specific properties or to avoid interspecies contaminations, hindering their future translation into clinical and drug discovery approaches. In this work, we focused on the optimization of a reproducible protocol in feeder-free conditions able to generate functional glutamatergic neurons. This protocol is based on a generation of neuroprecursor cells differentiated into human neurons with the administration in the culture medium of specific neurotrophins in a Geltrex-coated substrate. We confirmed the efficiency of this protocol through molecular analysis (upregulation of neuronal markers and neurotransmitter receptors assessed by gene expression profiling and expression of the neuronal markers at the protein level), morphological analysis, and immunfluorescence detection of pre-synaptic and post-synaptic markers at synaptic boutons. The hiPSC-derived neurons acquired Ca2+-dependent glutamate release properties as a hallmark of neuronal maturation. In conclusion, our study describes a new methodological approach to achieve feeder-free neuronal differentiation from hiPSC and adds a new tool for functional characterization of hiPSC-derived neurons.

Keywords: diseases modelling; human neurons; human-induced pluripotent stem cells (hiPSC); neurotransmitter release; stem cells.


Conflict of interest statement

The authors declare no conflict of interest. The funders had no role in the design of the study; in the collection, analyses, or interpretation of data; in the writing of the manuscript; or in the decision to publish the results.

Figures

Figure 1
Figure 1
Differentiation from human-induced pluripotent stem cells (hiPSCs) to neuronal cells. (A) Schematic diagram showing the differentiation protocol: from left to right, hiPSCs, Embyoid Bodies (EBs), Neuronal Rosettes, sun-shaped structure with rays from the center (Rosettes), Neuroprecursors (NPCs) and hiPSC-derived Neurons. Scale bar 10 µm. (B) Representative images of immunofluorescence (IF) of embryonic stem cell surface markers: Stage specific embryonic antigen-1 (SSEA1; green) and Octamer-binding transcription factor 4 (OCT4; red) (top image), and SRY-Box Transcription Factor 2 (SOX2; green) and T cell receptor alpha locus 1-60 (TRA-1-60; red) (bottom image). Cells were stained with nuclear marker 4′,6-diamidino-2-phenylindole, DAPI (blue). Scale bar 10 µm. (C) RT-qPCR shows upregulation of Sox1 and Pax6 in NPCs, as compared to hiPSCs. Nestin and Sox2 involved in pluripotency and neuronal differentiation are expressed in NPCs and hiPSCs. Bar graphs show the mean values ± SEM of relative expression, at least n = 3 replicate for each group. * p < 0.05, ** p < 0.01, **** p < 0.0001, by one way ANOVA, Bonferroni’s multiple comparisons.
Figure 2
Figure 2
hiPSC-derived neurons express neuronal markers. (A) Gene expression profiling of hiPSC-derived neurons by qRT-PCR showing upregulation of neuronal markers in neurons at mature stages (30–45 days of differentiation in vitro (DIV)). Neuronal markers: Tubulin Beta 3 Class III (Tubb3), Microtubule-associated protein 2 (Map2); synaptic markers: Synaptosome Associated Protein 25 (Snap25) (pre-synaptic), Vesicle Associated Membrane Protein 2 (Vamp2) (pre-synaptic), Synaptophysin (Syp) (pre-synaptic), Discs Large MAGUK Scaffold Protein 4 (Postsynaptic density protein 95) (Psd95) (post-synaptic); Vesicular Glutamate Transporters type: V-Glut2, V-Glut3; Calcium Voltage-Gated Channel Subunits Alpha1A,B,D,E: Cacna1a, Cacna1b, Cacna1d, Cacna1e. Bar graphs show the mean ± SEM of relative expression; at least n = 3 replicate for each group. * p < 0.05, ** p < 0.01, *** p < 0.001, **** p < 0.0001, by one way ANOVA, Bonferroni’s multiple comparisons tests. NPCs were used as negative control. (B) Representative images of western blot scans showing total PSD95, SV2A, V-GLUT2, TUBB3, SYP, and Glyceraldehyde-3 phosphate dehydrogenase (GAPDH) protein levels from hiPSC-derived neurons (30–45 DIV), NPCs and rat brain synaptosomes (RBS). (C) Western blot quantification of PSD95, SV2A, V-GLUT2, TUBB3, and SYP. Values were normalized on GAPDH expression. Bar graphs show the mean ± SEM of relative expression; at least n = 3 replicate for each group. * p < 0.05, ** p < 0.01, *** p < 0.001, by one way ANOVA, Bonferroni’s multiple comparisons tests. NPCs were used as a negative control.
Figure 3
Figure 3
Morphological analysis on hiPSC-derived neurons. (A) Sholl analysis showing an increase in branching at the analyzed time points: 7, 14, 21 DIV. (B) Area under the curve (AUC) from 10 µm to 80 µm graph showing significant increment of dendritic outgrowth at 7, 14, 21 DIV. Histogram values were means ± SEM. * p < 0.05, *** p < 0.001 by one way ANOVA, Bonferroni’s multiple comparisons tests.
Figure 4
Figure 4
Expression of N-methyl-D-aspartate (NMDA) receptor, Muscarinic acetylcholine receptor (mAChR) and 5-Hydroxytryptamine receptor (5HTR) in NPC and hiPSC-derived neurons. Bar graphs showing RT-qPCR results for Glutamate Ionotropic Receptor NMDA Type Subunit 1 (Grin1; (A)), Cholinergic Receptor Muscarinic 3 (Chrm3; (B)), and 5-Hydroxytryptamine Receptor 2A (Htr2a; (C)) at 30 and 45 DIV. All receptors showed upregulation in hiPSC-derived neurons compared to NPCs. Histogram bars represent the mean values ± SEM of relative expression, at least n = 3 replicated for each group. * p < 0.05, ** p < 0.01, **** p < 0.0001, by one way ANOVA, Bonferroni’s multiple comparisons.
Figure 5
Figure 5
Expression of neuronal proteins in hiPSC-derived neurons. (A) Representative confocal images of hiPSC-derived neurons at 30–45 DIV showing expression of the neuronal markers TUBB3 and MAP2 and the astrocyte marker Glial Fibrillary Acidic Protein (GFAP). Scale bar 7.5 µm. (B) Synaptic proteins SV2A (green) and HOMER (red) co-localized at 30–45 DIV. Scale bar 7.5 µm. The rectangle frames are the regions of interest shown below at higher magnification.
Figure 6
Figure 6
Exocytotic (Ca2+-dependent) release of glutamate from hiPSC-derived neurons at 30 and 45 DIV. (A) K+-evoked glutamate release from hiPSC-derived neurons in superfusion at 30 and 45 DIV. Data are expressed as mean ± SEM from three to seven different experiments. (B) 4AP-evoked glutamate release from hiPSC-derived neurons in superfusion at 30 and 45 DIV. Data are expressed as mean ± SEM from three to seven different experiments. (A) *** p < 0.001 vs. effect in NPCs, # p < 0.001 vs. K+ in 1.2 mM Ca2+ at the same day of differentiation and $ p < 0.05 vs. K+ in 1.2 mM Ca2+ at 30 DIV; (B) *** p < 0.001 vs. 4-AP in NPCs, # p < 0.001 vs. 4-AP in 1.2 mM Ca2+ at the same day of differentiation (one way ANOVA followed by Bonferroni’s post hoc test). For other experimental details see Materials and Methods.
Figure 7
Figure 7
Time courses for the evoked glutamate release. (A,B). K+-evoked glutamate release from hiPSC-derived neurons in superfusion. Representative time-courses for the release of tritium from hiPSC derived neurons at 30 (A) and 45 (B) day of differentiation are shown. K+ was added (3 min; black bar) during superfusion. (C,D). 4-AP-evoked glutamate release from hiPSC-derived neurons in superfusion. The representative time courses for the release of tritium from hiPSC-derived neurons at 30 (C) and 45 (D) days of differentiation are shown. 4-AP was added (3 min; black bar) during superfusion. For other experimental details see Materials and Methods.

Similar articles

Cited by

References

    1. Bal-Price A., Pistollato F., Sachana M., Bopp S.K., Munn S., Worth A. Strategies to improve the regulatory assessment of developmental neurotoxicity (DNT) using in vitro methods. Toxicol. Appl. Pharmacol. 2018;354:7–18. doi: 10.1016/j.taap.2018.02.008. - DOI - PMC - PubMed
    1. Krewski D., Acosta D., Jr., Andersen M., Anderson H., Bailar J.C., 3rd, Boekelheide K., Brent R., Charnley G., Cheung V.G., Green S., Jr., et al. Toxicity testing in the 21st century: A vision and a strategy. J. Toxicol. Environ. Health B Crit. Rev. 2010;13:51–138. doi: 10.1080/10937404.2010.483176. - DOI - PMC - PubMed
    1. Baumann J., Gassmann K., Masjosthusmann S., DeBoer D., Bendt F., Giersiefer S., Fritsche E. Comparative human and rat neurospheres reveal species differences in chemical effects on neurodevelopmental key events. Arch. Toxicol. 2016;90:1415–1427. doi: 10.1007/s00204-015-1568-8. - DOI - PubMed
    1. Pistollato F., de Gyves E.M., Carpi D., Bopp S.K., Nunes C., Worth A., Bal-Price A. Assessment of developmental neurotoxicity induced by chemical mixtures using an adverse outcome pathway concept. Environ. Health. 2020;19:23. doi: 10.1186/s12940-020-00578-x. - DOI - PMC - PubMed
    1. Consiglio E.D., Pistollato F., Gyves E.M.-D., Bal-Price A., Testai E. Integrating biokinetics and in vitro studies to evaluate developmental neurotoxicity induced by chlorpyrifos in human iPSC-derived neural stem cells undergoing differentiation towards neuronal and glial cells. Reprod. Toxicol. 2020;98:174–188. doi: 10.1016/j.reprotox.2020.09.010. - DOI - PMC - PubMed

LinkOut - more resources