. 2022 Sep 11;23(18):10554.
doi: 10.3390/ijms231810554.

Targeting PSEN1 by lnc-CYP3A43-2/miR-29b-2-5p to Reduce β Amyloid Plaque Formation and Improve Cognition Function

Affiliations

Targeting PSEN1 by lnc-CYP3A43-2/miR-29b-2-5p to Reduce β Amyloid Plaque Formation and Improve Cognition Function

Wei Wuli et al. Int J Mol Sci. .

Abstract

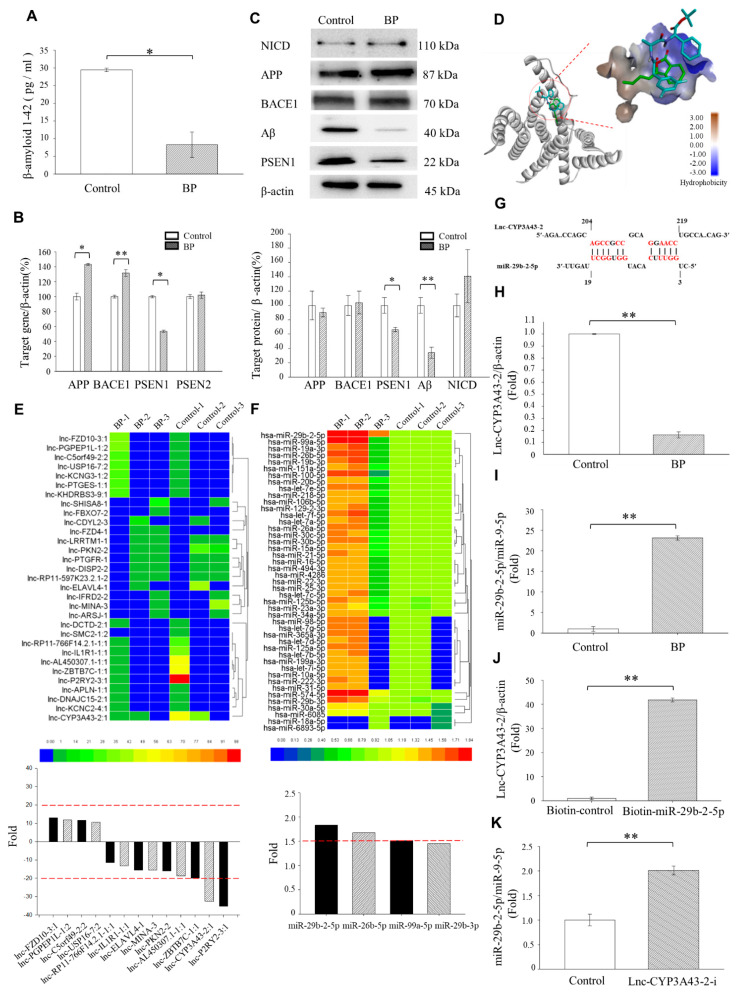
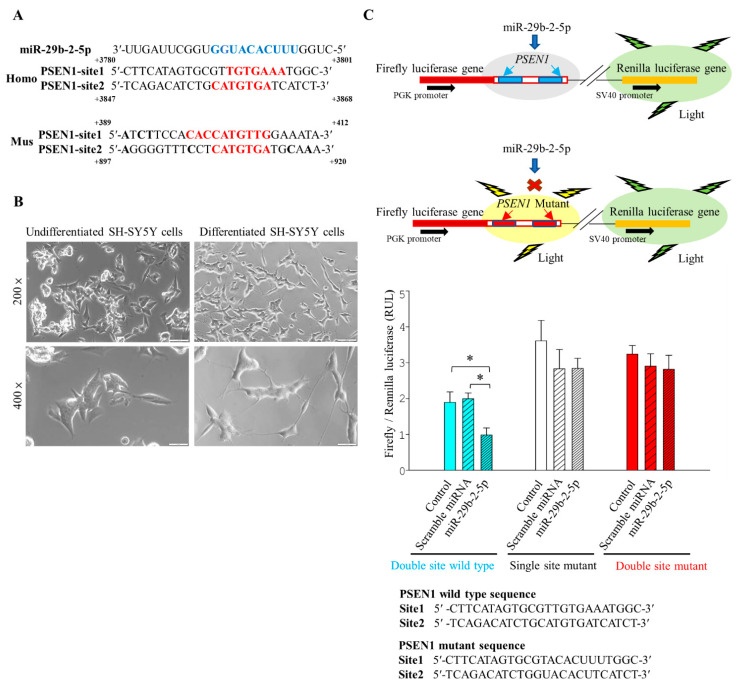
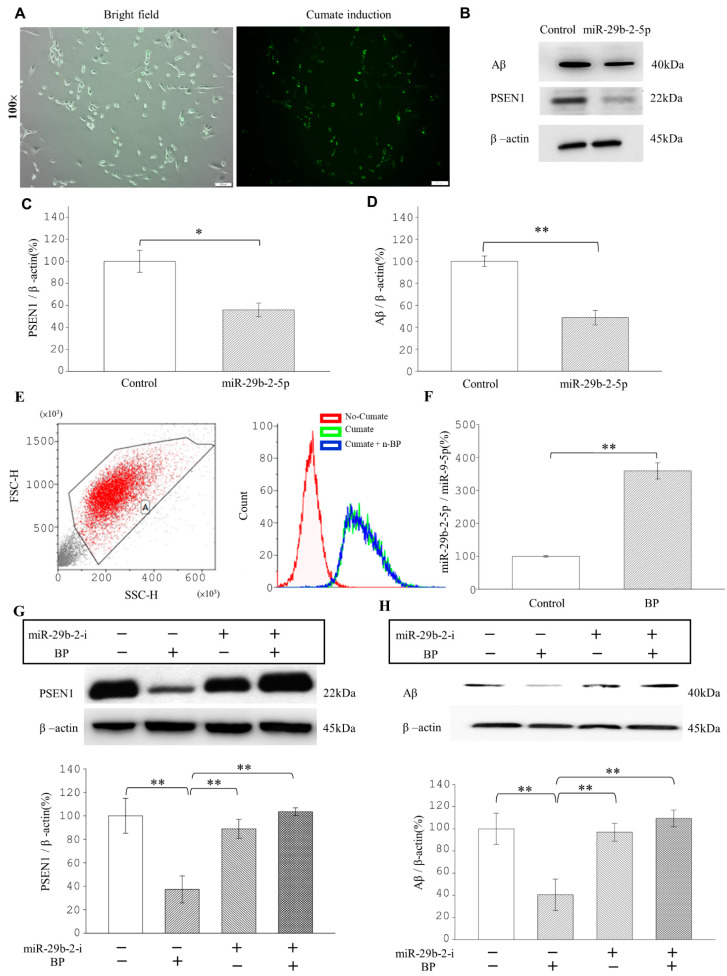
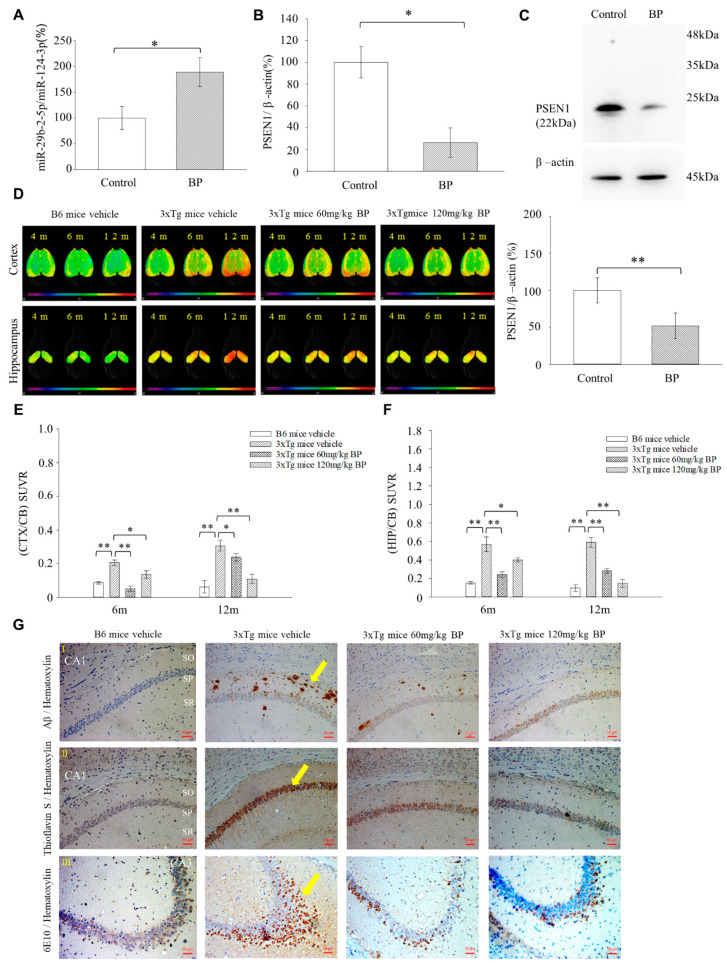
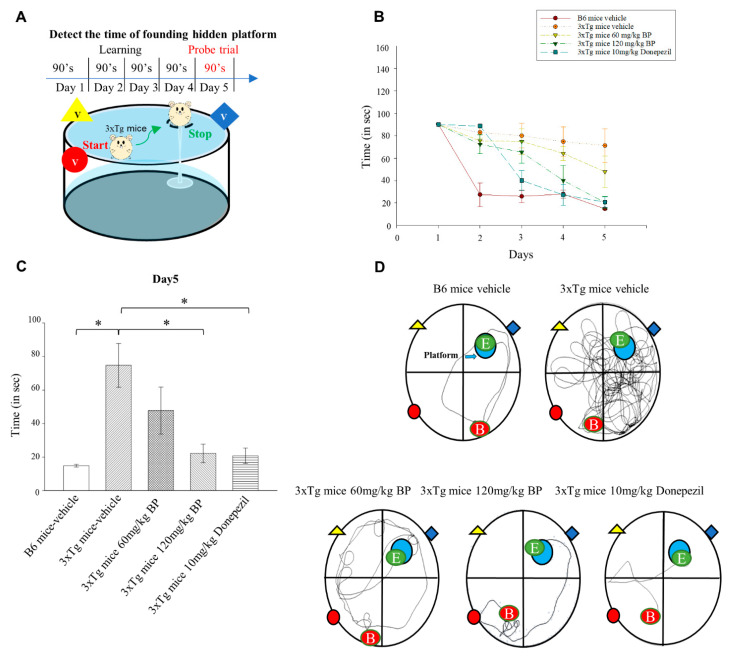
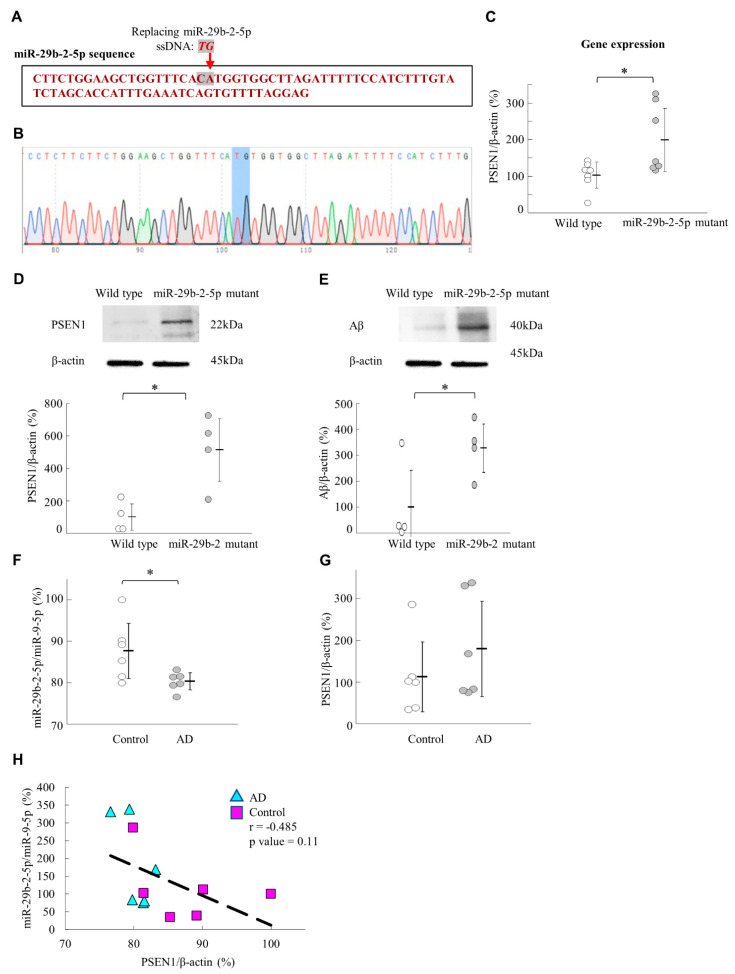
Presenilin-1 (PSEN1) is a crucial subunit within the γ-secretase complex and regulates β-amyloid (Aβ) production. Accumulated evidence indicates that n-butylidenephthalide (BP) acts effectively to reduce Aβ levels in neuronal cells that are derived from trisomy 21 (Ts21) induced pluripotent stem cells (iPSCs). However, the mechanism underlying this effect remains unclear. This article aims to investigate the possible mechanisms through which BP ameliorates the development of Alzheimer's disease (AD) and verify the effectiveness of BP through animal experiments. Results from RNA microarray analysis showed that BP treatment in Ts21 iPSC-derived neuronal cells reduced long noncoding RNA (lncRNA) CYP3A43-2 levels and increased microRNA (miR)-29b-2-5p levels. Bioinformatics tool prediction analysis, biotin-labeled miR-29b-2-5p pull-down assay, and dual-luciferase reporter assay confirmed a direct negative regulatory effect for miRNA29b-2-5p on lnc-RNA-CYP3A43-2 and PSEN1. Moreover, BP administration improved short-term memory and significantly reduced Aβ accumulation in the hippocampus and cortex of 3xTg-AD mice but failed in miR-29b-2-5p mutant mice generated by CRISP/Cas9 technology. In addition, analysis of brain samples from patients with AD showed a decrease in microRNA-29b-2-5p expression in the frontal cortex region. Our results provide evidence that the LncCYP3A43-2/miR29-2-5p/PSEN1 network might be involved in the molecular mechanisms underlying BP-induced Aβ reduction.

Keywords: Alzheimer’s disease; Presenilin1; miR-29b-2-5p; n-butylidenephthalide; β-amyloid plaque.


Conflict of interest statement

The authors declare no conflict of interest.

Figures

Figure 1
Figure 1
Increased miRNA-29b-2-5p expression and decreased PSEN1 and Aβ expressions in BP-treated Ts21-iPSC-derived neurons. (A) Quantification of Aβ42 levels in the medium of control and BP-treated cells evaluated using ELISA (Control = 29.44 pg/mL ± 1.05, BP = 8.28 pg/ml ± 7.31), n = 3 for each group. (B) The expression of AD-associated gene/β-actin with or without 100 μM BP (APP of Control = 100% ± 4.5 vs. BP = 144.59% ± 1.19; BACE1 of Control = 100% ± 1.79 vs. BP = 131% ± 4.44; PSEN1 of Control = 100% ± 6.0 vs. BP = 51.9% ± 1.52), n = 3 for each group. (C) Representative western blot analysis of APP, BACE1, PSEN1, and Aβ levels after 48 h with or without 100 μM BP (APP of Control = 100% ± 24.03 vs. BP = 89.96% ± 7.54; BACE1 of Control = 100% ± 18.57 vs. BP = 103.94 % ± 20.79; PSEN1 of Control = 100% ± 16.37 vs. BP = 65.94% ± 6.86; Aβ of Control = 100% ± 16.13 vs. BP = 39.59% ± 6.63). (D) The binding structure simulation between BP (green stick) and DAPT (cyan stick) with PSEN1. (Left) The gray ribbon shows the 3D structure of PSEN1; (right) the enlargement of the active site of PSEN1 is shown by the surface model. The red color indicates the amino acids with strong hydrogen-bonding donor properties. (E,F) Gene microarray analysis of lncRNA and miRNA after BP treatment of Ts21-iPSCs and controls. (G) The predicted binding sites between lnc-CYP3A43 and miR-29b-2-5p. (H,I) RT-qPCR analysis of the expression levels of lnc-CYP3A43-2/β-actin and miR-29b-2-5p/miR-9-5p (lnc-CYP3A43-2/β-actin: Control = 1fold ± 0.02 vs. BP: 0.17fold ± 0.05; miR-29b-2-5p/miR-9-5p: Control = 1fold ± 0.09 vs. BP = 23.11fold ± 0.12), n = 3. (J) Real-time PCR results of miRNA expression from biotin-based pulldown assay validate the lnc-CYP3A43-2 targets of cellular miR-29b-2-5p (Control = 1fold ± 0.25 vs. BP = 41.81fold ± 0.09), n = 3. (K) Real-time PCR results of cellular miR-29b-2-5p expression levels after the inhibition of lnc-CYP3A43-2(Control = 1fold ± 0.17 vs. BP = 1.87fold ± 0.11), n = 3. * p < 0.05. ** p < 0.01.
Figure 2
Figure 2
Luciferase assay indicated that miR-29b-2-5p targets 3′ UTR of PSEN1 in SH-SY5Y cells. (A) Sequence and predicted base pairing of human miR-29b-2-5p with PSEN1. Two predicted target sites in human PSEN1 3′UTR are located at 3791–3797 and 3856–3862 nucleotides from the start of PSEN1 3′UTR. Mouse PSEN1 3′UTR are located at 397–404 and 908–914 nucleotides from the start of PSEN1 3′UTR. (B) Differentiated neuronal SH-SY5Y cells (left) are morphologically distinct from undifferentiated SH-SY5Y cells (right). Scale bars represent 100 μm (up) and 50 μm (down) (C). The pmirGLO vector is designed to quantitatively evaluate PSEN1 activity by inserting PSEN1 3′UTR target sites downstream of the firefly luciferase gene, and the Renilla luciferase gene provides the necessary information normalization. The target sites of wild-type and mutant reporter constructs were transfected into neuronal SH-SY5Y cells alone or with 50 nM miR-29b-2-5p. The relative ratios of Renilla and firefly luciferase activity were measured. The expression of wild-type PSEN1 decreased the expression of the reporter (blue bar). PSEN1 single-site-2 mutation (white bar) or PSEN1 double mutation (red bar) of miR-29b-2-5p abolished the inhibitory effect of miR-29b-2-5p on reporter expression The miR-29b-2-5p mimic significantly reduced the luciferase expression of the wild-type reporter (52.05%). This decrease in luciferase expression was diminished by mutation at one site in the reporter (74.31%) and abolished by two mutations in the reporter (86.97%). Blue bar: Control vs. Scramble miRNA vs. miR-29b-2-5p mimics = 1.89 RUL ± 0.29 vs. 1.99 RUL ± 0.16 vs. 0.98 RUL ± 0.19; White bar: Control vs. add scramble miRNA vs. add miR-29b-2-5p mimics = 3.60 RUL ± 0.56 vs. 2.82 RUL ± 0.53 vs. 2.68 RUL ± 0.63; Red bar: Control vs. add scramble miRNA vs. add miR-29b-2-5p mimics = 3.23 RUL ± 0.23 vs. 2.83 RUL ± 0.28 vs. 2.81 RUL ± 0.39. n = 3 for each group. * p < 0.05.
Figure 3
Figure 3
miRNA-29b-2-5p and BP decreased PSEN1 and Aβ expressions in β-CTF/C6 cells. (A) Left image, the morphology of β-CTF/C6 cells (bright field). Right image, green fluorescence emitted by β-CTF/C6 cells producing Aβ. Scale bars represent 100 μm. (BD) miRNA-29b-2-5p treatment decreased PSEN1 protein expression and Aβ peptide levels. PSEN1: Control = 100% ± 15.45 vs. BP = 55.91% ± 15.25; Aβ: Control = 100% ± 8.01 vs. BP = 48.05% ± 0.11), n = 3 for each group. (E) Flow cytometry analysis of β-CTF/C6 cells treated with BP. Treat circled cells as a group (“A”) (Left). Right-Red peak, the fluorescence of β-CTF/C6 cells without Cumate activation (background). Green peak, with Cumate. Blue peak, with BP (Right). The similarity between the blue and green peaks indicates that BP does not affect the fluorescence of β-CTF/C6 cells. (F). RT-qPCR analysis of the expression levels of miR-29b-2-5p/miR-9-5p with or without 100 μM BP. miR-29b-2-5p/miR-9-5p: Control = 100% ± 3.74 vs. BP = 361.88% ± 7.44). Western blot analysis of PSEN1 (G) and Aβ (H) levels after 48 h with or without 100 μM BP in the absence or presence of miRNA-29b-2-5p. PSEN1/β-actin: Control = 100% ± 14.08 vs. BP = 41.45% ± 10.54 vs. miRNA-29b-2-i = 109% ± 3.44 vs. BP + miR-29b-2-i = 244.5% ± 11.15; Aβ/β-actin -Control = 100% ± 21.99 vs. BP = 40.81% ± 12.88 vs. miRNA-29b-2-i = 115% ± 9.8 vs. BP + miR-29b-2-i = 229.04% ± 12.85), n = 3 for each group. * p < 0.05. ** p < 0.01. miRNA-29b-2-i; miRNA-29b-2-inhibitor.
Figure 4
Figure 4
BP decreased Aβ deposition in the hippocampus of 3xTg mice. RT-PCR analysis of the expression levels of miR-29b-2-5p gene (A) and PSEN1 gene (B) in the hippocampus of BP-treated 3xTg mice (miR-29b-2-5p: Control = 100% ± 28.4 vs. BP = 189.49% ± 14.82; PSEN1: Control = 100% ± 19.22 vs. BP = 26.26% ± 23.24), n = 4. (C) western blot analysis of PSEN1 in the hippocampus of BP-treated 3xTg AD mice. PSEN1 was reduced in the BP treated group (Control = 100% ± 23.20 vs. BP = 51.79% ± 19.73), n = 4. * p < 0.05. ** p < 0.01. (D) 3D radiotracer [18F]-FBB images show Aβ accumulation in the brains of 3xTg mice. After 4–12 months, the B6 control mice exhibited no Aβ accumulation (green color). The 3xTg transgenic mice demonstrated amyloid deposits in the hippocampus (HIP) and cortex (CTX) of the brain and tended to accumulate amyloids after 12 months of birth (orange-red color). Oral administration of BP (60 or 120 mg/kg) resulted in low levels of amyloid accumulation. SUVR; standard uptake value ratio, M; months, cerebellum: CB. Comparison of VOI-based [18F]-FBB SUVR (CTX/CB) (E) and SUVR (HIP/CB) (F) between vehicle-treated B6 mice, vehicle-treated 3xTg transgenic, and BP-treated 3xTg mice (60 mg/kg and 120 mg/kg) at the age of 6 and 12 months (CTX/CB-6m: Vehicle-treated B6 mice = 0.09 ± 0.01, Vehicle-treated 3xTg mice = 0.21 ± 0.04, 60 mg/kg BP-treated 3xTg mice = 0.06 ± 0.01, 120 mg/kg BP-treated 3xTg mice = 0.13 ± 0.05; CTX/CB-12m: Vehicle-treated B6 mice = 0.06 ± 0.04, Vehicle-treated 3xTg mice = 0.30 ± 0.03, 60 mg/kg BP-treated 3xTg mice = 0.23 ± 0.03, 120 mg/kg BP-treated 3xTg mice = 0.10 ± 0.03; HIP/CB-6m: Vehicle-treated B6 mice = 0.15 ± 0.02, Vehicle-treated 3xTg mice = 0.56 ± 0.16, 60 mg/kg-treated 3xTg mice = 0.24 ± 0.05, 120 mg/kg-treated 3xTg mice = 0.39 ± 0.04; HIP/CB-12m: Vehicle-treated B6 mice = 0.09 ± 0.07, Vehicle-treated 3xTg mice = 0.59 ± 0.11, 60 mg/kg-treated 3xTg mice = 0.28 ± 0.04, 120 mg/kg-treated 3xTg mice = 0.14 ± 0.08), n = 4 for vehicle-treated and n = 5 for vehicle-treated 3xTg mice, 60 mg/kg BP-treated 3xTg mice and 120 mg/kg BP-treated 3xTg mice. (G-I) Immunostaining with Aβ antibody to detect amyloid deposition in the CA1 area of the hippocampus. Brown dots indicated Aβ plaque accumulation (Yellow arrow). We observed Aβ plaques on both sides of the sp in vehicle-treated 3xTg transgenic mice but not in vehicle-treated B6 mice. Moreover, the Aβ plaques of 60 and 120 mg/kg BP-treated 3xTg mice were significantly reduced. (G-II) Results of Th-S staining. A similar trend of Aβ plaques in the SP areas of each group was observed in the SP area of CA1 using Th-S staining (Yellow arrow). Brain sections were selected at −2.2 mm posterior to the bregma. n = 4 for B6 mice vehicle, vehicle-treated 3xTg mice n = 5 for 60 mg/kg and 120 mg/kg BP-treated 3xTg mice. (G-III) Immunostaining with 6E10 antibody to detect amyloid deposition in the hippocampus. Brown dots indicated amino acids 6–10 of Aβ accumulation (Yellow arrow). We observed amino acids 6–10 of Aβ from CA1 diffuse to CA3 in vehicle-treated 3xTg transgenic mice but not in B6 mice. Moreover, the amino acids 6–10 of Aβ of 60 and 120 mg/kg BP-treated 3xTg mice were significantly reduced. n = 4 for B6 mice vehicle, vehicle-treated 3xTg mice. n = 5 for 60 mg/kg and 120 mg/kg BP-treated 3xTg mice. * p < 0.05. ** p < 0.01. Scale bars represent 50 μm. SO: stratum oriens; SP: stratum piramidale; SR: stratum radiatum. CA: Cornu Ammonis areas.
Figure 5
Figure 5
BP ameliorates spatial learning and memory in 3xTg AD mice. (A) We have trained the B6 mice and 3xTg mice to find the platforms hidden in the water. Our training time is five days, 90 s each time, once a day. s: second (B) The time spent to reach the platform in each group on Day 1 to Day 5. (C) Time spent in the target quadrant during the test for each group on Day 5. Time spent in the target: B6 mice—vehicle = 14.86 s ± 1.49, 3xTg mice—vehicle = 74.74 s ± 23.83, n = 6; 60 mg/kg BP-treated 3xTg mice = 47.84 s ± 25.69, n = 4; 120 mg/kg BP-treated 3xTg mice = 22.22 s ± 10.14, n = 6; 10 mg/kg treated 3xTg mice = 20.83 s ± 8, n = 4. * p < 0.05. (D) Representative swimming route map of each group on the last day of training. Red dot, the starting point of the swim; green dot, the end point of the swim. The marker of the red circle, yellow triangle, and blue diamond are visual cues.
Figure 6
Figure 6
miRNA-29b-2-5p negatively regulates PSEN1 expression and Aβ. (A) The red-labeled nucleotides are wild-type miR-29b-2-5p sequences. In the mutant mice, CA nucleotides were replaced with TG. (B) The DNA sequence mapping of miR-29b-2-5p in mir29b-2-5p mutant mice. The C change to T and A change to G. (C) RT-qPCR analysis of the expression levels of PSEN1 in the hippocampus of miR-29b-2-5p-mutant mice (Wild type = 100% ± 36.86 vs. miR-29b-2-5p mutant = 193.45% ± 46.80), n = 7. (D,E) western blot analysis of PSEN1 and Aβ in the hippocampus of wild type mice and miR-29b-2-5p-mutant mice (PSEN1/β-actin: Wild type = 100% ± 92.92 vs. miR-29b-2-5p mutant = 515.24% ± 43.25; Aβ/β-actin: Wild type = 100% ± 164.93 vs. miR-29b-2-5p mutant = 341.97% ± 31.85), n = 4 for each group. The expression levels of miR-29b-2-5p (F) and PSEN1 (G) in human brain BA9 specimens compared with those of control groups using RT-qPCR analysis. n = 6 for each group. (miR-29b-2-5p/ miR-9b-5p: Control = 100% ± 8.62 vs. AD = 91.61% ± 2.81; PSEN1/β-actin: Control = 100% ± 81.52 vs. AD = 159.87% ± 69.66) (n = 6 for each group), * p < 0.05. (H) The correlation analysis between miR-29b-2-5p and PSEN1 in human brain BA9 specimens; correlation coefficient (r) = −0.485, p = 0.11. The average age of control vs. AD = 84.3 ± 2.9 vs. 85.3 ± 3.4; The average post-mortem interval of control vs. AD = 420 min ± 346 vs. 375 min ± 252.

Similar articles

Cited by

References

    1. 2021 Alzheimer’s disease facts and figures. Alzheimers Dement. 2021;17:327–406. doi: 10.1002/alz.12328. - DOI - PubMed
    1. Roher A.E., Lowenson J.D., Clarke S., Woods A.S., Cotter R.J., Gowing E., Ball M.J. beta-Amyloid-(1-42) is a major component of cerebrovascular amyloid deposits: Implications for the pathology of Alzheimer disease. Proc. Natl. Acad. Sci. USA. 1993;90:10836–10840. doi: 10.1073/pnas.90.22.10836. - DOI - PMC - PubMed
    1. Van Bokhoven P., de Wilde A., Vermunt L., Leferink P.S., Heetveld S., Cummings J., Scheltens P., Vijverberg E.G.B. The Alzheimer’s disease drug development landscape. Alzheimers Res. Ther. 2021;13:186. doi: 10.1186/s13195-021-00927-z. - DOI - PMC - PubMed
    1. Chang C.Y., Chen S.M., Lu H.E., Lai S.M., Lai P.S., Shen P.W., Chen P.Y., Shen C.I., Harn H.J., Lin S.Z., et al. N-butylidenephthalide attenuates Alzheimer’s disease-like cytopathy in Down syndrome induced pluripotent stem cell-derived neurons. Sci. Rep. 2015;5:8744. doi: 10.1038/srep08744. - DOI - PMC - PubMed
    1. O’Brien R.J., Wong P.C. Amyloid precursor protein processing and Alzheimer’s disease. Annu. Rev. Neurosci. 2011;34:185–204. doi: 10.1146/annurev-neuro-061010-113613. - DOI - PMC - PubMed