. 2022 Sep 12;23(18):10565.
doi: 10.3390/ijms231810565.

Identification of the Regulatory Targets of miR-3687 and miR-4417 in Prostate Cancer Cells Using a Proteomics Approach

Affiliations

Identification of the Regulatory Targets of miR-3687 and miR-4417 in Prostate Cancer Cells Using a Proteomics Approach

Simone Venz et al. Int J Mol Sci. .

Abstract

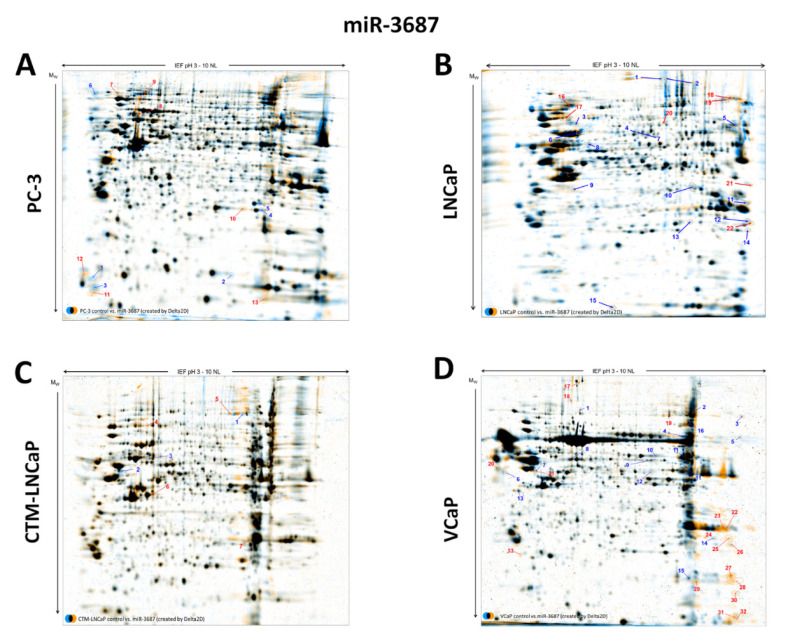
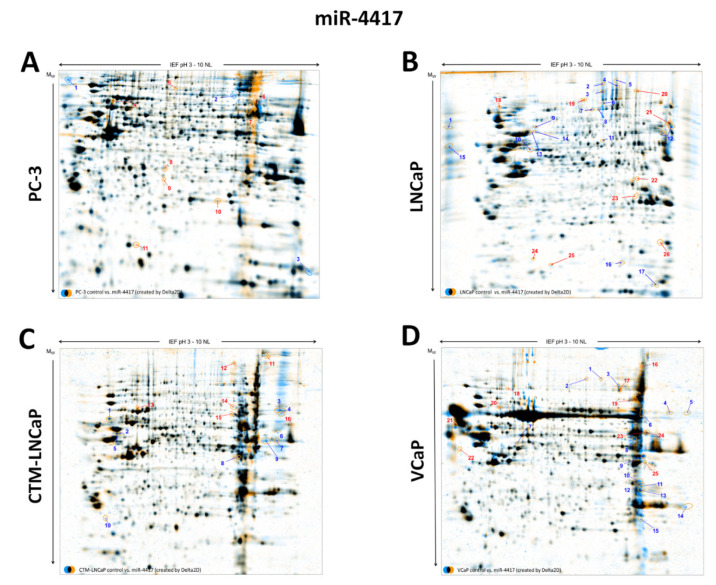
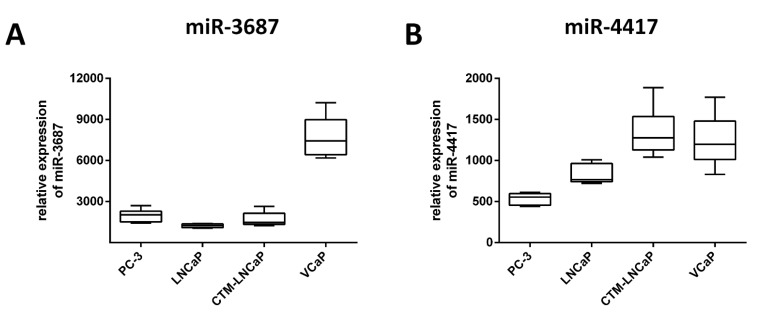
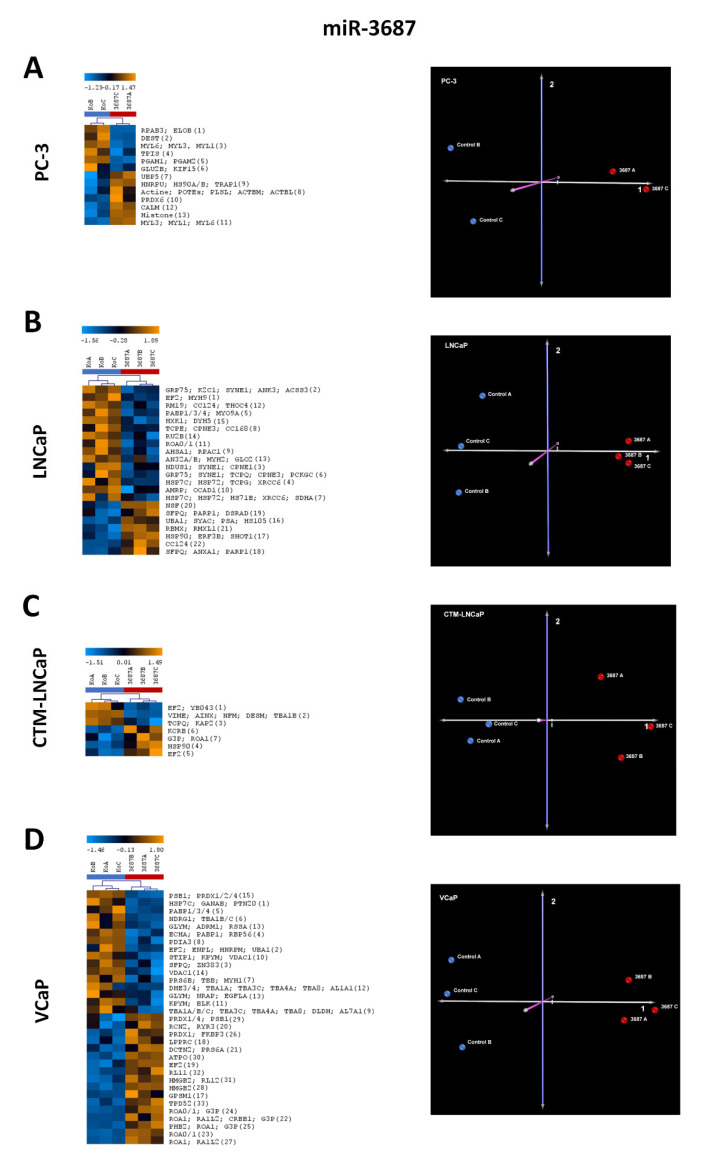
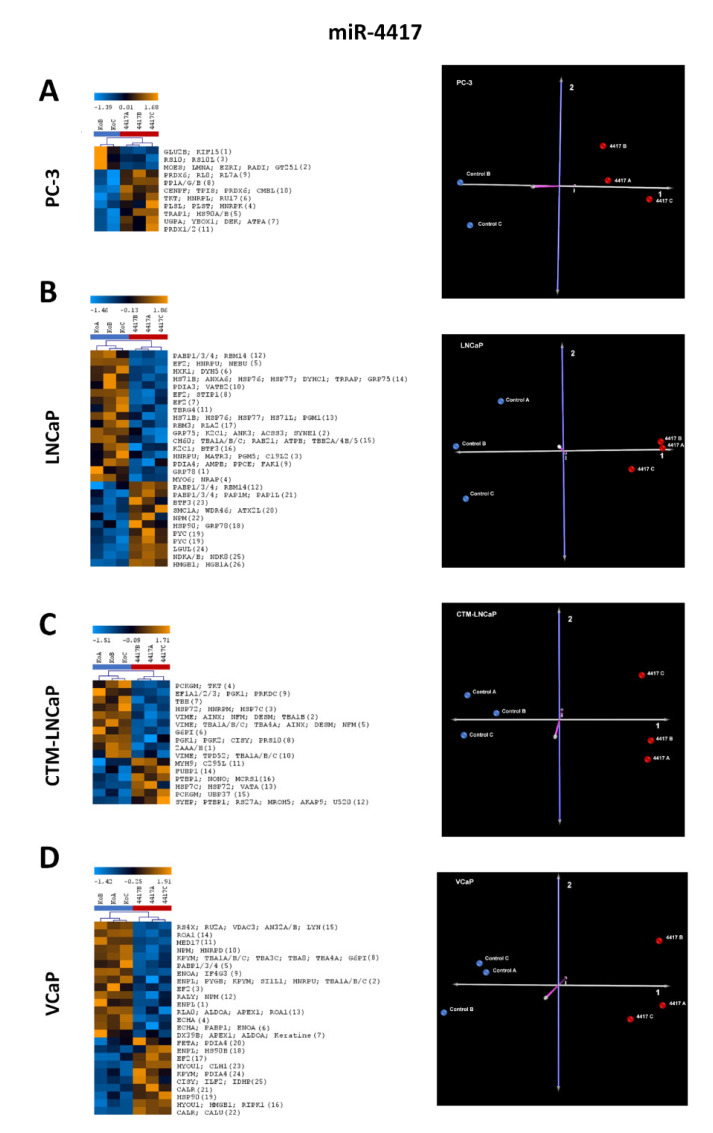
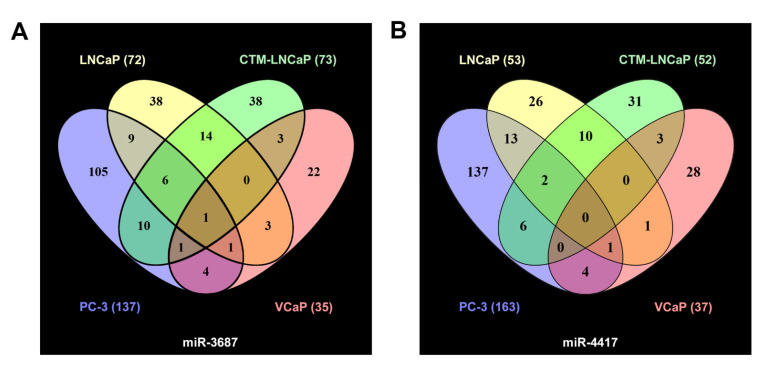
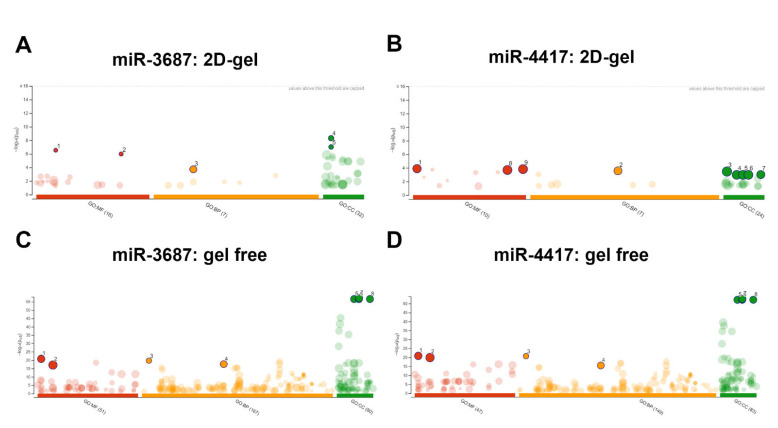
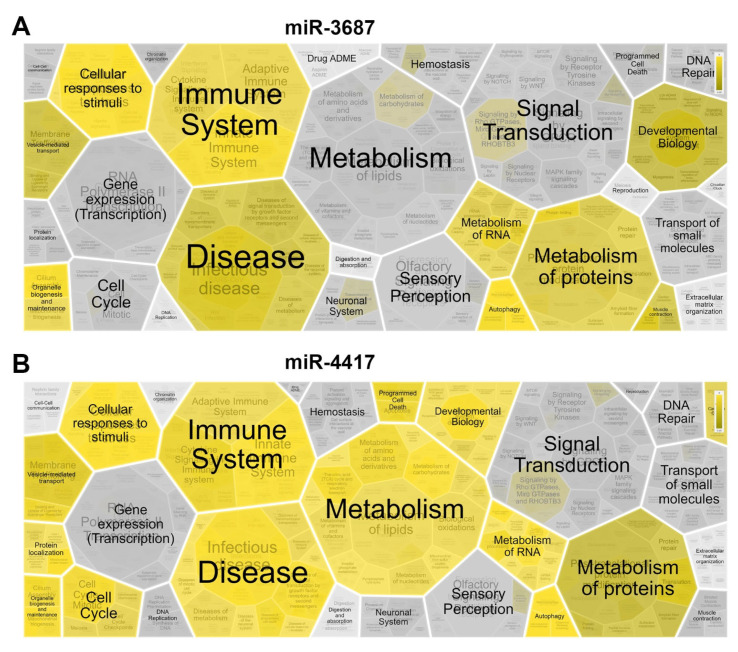
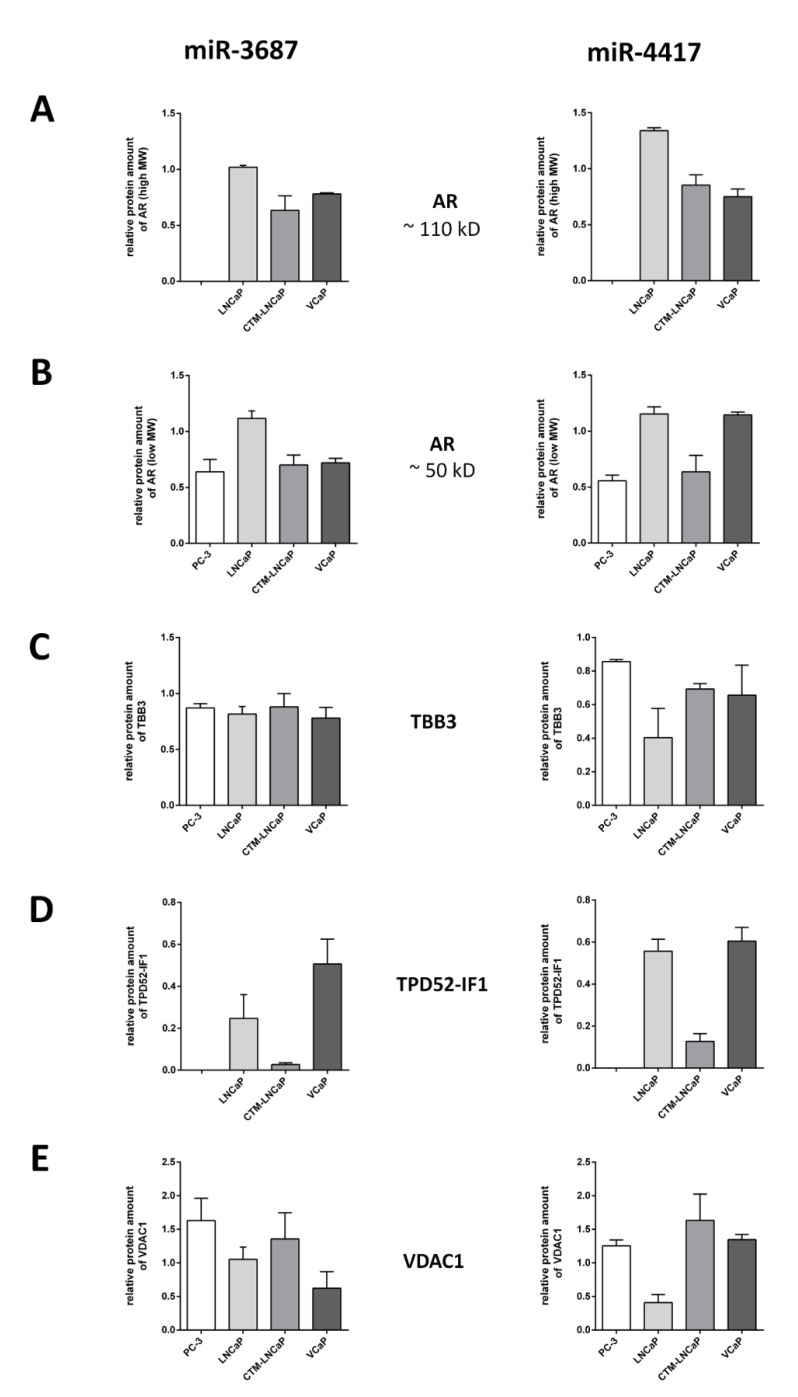
MicroRNAs (miRNA) are ubiquitous non-coding RNAs that have a prominent role in cellular regulation. The expression of many miRNAs is often found deregulated in prostate cancer (PCa) and castration-resistant prostate cancer (CRPC). Although their expression can be associated with PCa and CRPC, their functions and regulatory activity in cancer development are poorly understood. In this study, we used different proteomics tools to analyze the activity of hsa-miR-3687-3p (miR-3687) and hsa-miR-4417-3p (miR-4417), two miRNAs upregulated in CRPC. PCa and CRPC cell lines were transfected with miR-3687 or miR-4417 to overexpress the miRNAs. Cell lysates were analyzed using 2D gel electrophoresis and proteins were subsequently identified using mass spectrometry (Maldi-MS/MS). A whole cell lysate, without 2D-gel separation, was analyzed by ESI-MS/MS. The expression of deregulated proteins found across both methods was further investigated using Western blotting. Gene ontology and cellular process network analysis determined that miR-3687 and miR-4417 are involved in diverse regulatory mechanisms that support the CRPC phenotype, including metabolism and inflammation. Moreover, both miRNAs are associated with extracellular vesicles, which point toward a secretory mechanism. The tumor protein D52 isoform 1 (TD52-IF1), which regulates neuroendocrine trans-differentiation, was found to be substantially deregulated in androgen-insensitive cells by both miR-3687 and miR-4417. These findings show that these miRNAs potentially support the CRPC by truncating the TD52-IF1 expression after the onset of androgen resistance.

Keywords: castration-resistant prostate cancer; cellular regulation; microRNA; prostate cancer; proteomics.


Conflict of interest statement

The authors declare no conflict of interest regarding the present study.

Figures

Figure A1
Figure A1
Comparison pictures of the 2D gel electrophoresis analysis of four prostate cancer cell lines as overlay—with or without overexpression of miR-3687. (A): PC-3, (B): LNCaP, (C): CTM-LNCaP, (D): VCaP. Analysis with Delta 2D software gives overlay pictures with these information: spot quantity (blue spots—negative control miRNA#2 sample; orange spots—miR-3687 sample; black spots—overlay (similar protein amount within the spots)); spots of interest (cut off differences—1.8-fold) were labeled with numbers (blue—downregulated spot in miR-3687 sample, red—upregulated spot in miR-3687 sample).
Figure A2
Figure A2
Comparison pictures of the 2D gel electrophoresis analysis of four prostate cancer cell lines as an overlay—with or without overexpression of miR-4417. (A): PC-3, (B): LNCaP, (C): CTM-LNCaP, (D): VCaP. Analysis with Delta 2D software gives overlay pictures with this information: spot quantity (blue spots—negative control miRNA#2 sample; orange spots—miR-4417 sample; black spots—overlay (similar protein amount within the spots)); spots of interest (cut off differences—1.8-fold) were labeled with numbers (blue—downregulated spot in miR-4417 sample, red—upregulated spot in miR-4417 sample).
Figure 1
Figure 1
Relative expression of miRNA in prostate cancer cells after transient transfection. The transfection efficacy of miR-3687 (A) and miR-4417 (B) was analyzed using qPCR. Cultivation time: 6 days; Concentration of miR-3687 for: PC-3 20 nM, LNCaP 40 nM, CTM-LNCaP 40 nM, VCaP 20 nM; Concentration of miR-4417 for: PC-3 20 nM, LNCaP 40 nM, CTM-LNCaP 40 nM, VCaP 20 nM; Concentration of control miR for: PC-3 20 nM, LNCaP 40 nM, CTM-LNCaP 40 nM, VCaP 20 nM.
Figure 2
Figure 2
The 2D gel electrophoreses of the four prostate cancer cell line lysates after transfection with miR-3687 and mass spectrometric identification of differentially expressed proteins. (A) Results from PC-3 cells with a heatmap of identified proteins (13 spots comprising 27 proteins) in replicates and a principle component analysis (PCA) plot of the samples analyzed. (B) Results from LNCaP cells with a heatmap of identified proteins (22 spots comprising 64 proteins) in replicates and a PCA plot of the samples analyzed. (C) Results from CTM-LNCaP cells with a heatmap of identified proteins (7 spots comprising 14 proteins) in replicates and a PCA plot of the samples analyzed. (D) Results from VCaP cells with a heatmap of identified proteins (33 spots comprising 83 proteins) in replicates and a PCA plot of the samples analyzed. For all cell lines, PCA shows a clear separation between the experimental groups (miR-3687 transfection) and control groups (vector transfection), validating the impact that miRNA transfection has on overall protein expression. The number of spots identified in the 2D gels (Appendix A) is defined in brackets in the heat maps protein list. PCA axis components: 1 (gray), 2 (violet), and 3 (pink).
Figure 3
Figure 3
The 2D gel electrophoreses of the four prostate cancer cell line lysates after transfection with miR-4417 and mass spectrometric identification of differentially expressed proteins. (A) Results from PC-3 cells with a heatmap of identified proteins (11 spots comprising 34 proteins) in replicates and a principle component analysis (PCA) plot of the samples analyzed. (B) Results from LNCaP cells with a heatmap of identified proteins (28 spots comprising 56 proteins) in replicates and a PCA plot of the samples analyzed. (C) Results from CTM-LNCaP cells with a heatmap of identified proteins (16 spots comprising 53 proteins) in replicates and a PCA plot of the samples analyzed. (D) Results from VCaP cells with a heatmap of identified proteins (25 spots comprising 66 proteins) in replicates and a PCA plot of the samples analyzed. For all cell lines, PCA shows a clear separation between the experimental groups (miR-4417 transfection) and control groups (vector transfection), validating the impact that miRNA transfection has on overall protein expression. The number of spots identified in the 2D gels (Appendix B) is defined in brackets in the heat maps protein list. PCA axis components: 1 (gray), 2 (violet), and 3 (pink).
Figure 4
Figure 4
Proteome analysis of four prostate cancer cell lines after mass spectrometric identification—gel-free approach. (A) Venn diagram depicting the differentially expressed proteins and their overlap within the four cell lines analyzed after treatment with miR-3687. (B) Venn diagram depicting the differentially expressed proteins and their overlap within the four cell lines analyzed after treatment with miR-4417.
Figure 5
Figure 5
Functional enrichment analysis of differentially expressed proteins after miRNA transfection. (A) g:Profiler analysis for miR-3687 based on results from 2D-gel analysis (B) g:Profiler analysis for miR-4417 based on results from the 2D-gel analysis. (C) g:Profiler analysis for miR-3687 based on results from the gel-free analysis (D) g:Profiler analysis for miR-4417 based on results from the gel-free analysis. Figure legend: GO—gene ontology; molecular function (MF); biological pathways (BP); cellular component (CC); dots and numbers: ontology terms of interest (see Table 1).
Figure 6
Figure 6
Proteome analysis of the mass spectrometric identification results from the four analyzed cell lines. (A,B) Reactome network analysis depicted as a hierarchical Voronoi visualization for miR-3687 and miR-4417, respectively.
Figure 7
Figure 7
Quantitative Western blot analysis of proteins of interest after transfection with miR-3687 or miR-4417. (A) Androgen receptor (AR)—high molecular weight range (110 kD). (B) Androgen receptor (AR)—low molecular weight range (50 kD). (C) Beta-3-tubulin (TBB3). (D) Tumor protein D52 isoform 1 (TPD52-IF1). (E) Voltage-dependent anion-selective channel protein 1 (VDAC1). Expression values are depicted relative to transfection controls (1-fold).

Similar articles

Cited by

References

    1. Center M.M., Jemal A., Lortet-Tieulent J., Ward E., Ferlay J., Brawley O., Bray F. International variation in prostate cancer incidence and mortality rates. Eur. Urol. 2012;61:1079–1092. doi: 10.1016/j.eururo.2012.02.054. - DOI - PubMed
    1. Ferlay J., Shin H.R., Bray F., Forman D., Mathers C., Parkin D.M. Estimates of worldwide burden of cancer in 2008: GLOBOCAN 2008. Int. J. Cancer. 2010;127:2893–2917. doi: 10.1002/ijc.25516. - DOI - PubMed
    1. Marhold M., Kramer G., Krainer M., Le Magnen C. The prostate cancer landscape in Europe: Current challenges, future opportunities. Cancer Lett. 2022;526:304–310. doi: 10.1016/j.canlet.2021.11.033. - DOI - PubMed
    1. Cimadamore A., Mazzucchelli R., Lopez-Beltran A., Massari F., Santoni M., Scarpelli M., Cheng L., Montironi R. Prostate cancer in 2021: Novelties in prognostic and therapeutic biomarker evaluation. Cancers. 2021;13:3471. doi: 10.3390/cancers13143471. - DOI - PMC - PubMed
    1. Aly A., Mullins C.D., Hussain A. Understanding heterogeneity of treatment effect in prostate cancer. Curr. Opin. Oncol. 2015;27:209–216. doi: 10.1097/CCO.0000000000000172. - DOI - PubMed

LinkOut - more resources