. 2022 Sep 14;23(18):10681.
doi: 10.3390/ijms231810681.

CD73-Adenosinergic Axis Mediates the Protective Effect of Extracellular Vesicles Derived from Mesenchymal Stromal Cells on Ischemic Renal Damage in a Rat Model of Donation after Circulatory Death

Affiliations

CD73-Adenosinergic Axis Mediates the Protective Effect of Extracellular Vesicles Derived from Mesenchymal Stromal Cells on Ischemic Renal Damage in a Rat Model of Donation after Circulatory Death

Maria Antonietta Grignano et al. Int J Mol Sci. .

Abstract

We propose a new organ-conditioning strategy based on mesenchymal stromal cell (MSCs)/extracellular vesicle (EVs) delivery during hypothermic perfusion. MSCs/EVs marker CD73 is present on renal proximal tubular cells, and it protects against renal ischemia-reperfusion injury by converting adenosine monophosphate into adenosine (ADO). In this study, after checking if CD73-silenced EVs (EVsi) would impact in vitro tubular-cell proliferation, we perfused kidneys of a rat model of donation after circulatory death, with Belzer solution (BS) alone, BS supplemented with MSCs, EVs, or EVsi. The ADO and ATP levels were measured in the effluents and tissues. Global renal ischemic damage score (GRS), and tubular cell proliferation index (IPT) were evaluated in the tissue. EVsi did not induce cell proliferation in vitro. Ex vivo kidneys perfused with BS or BS + EVsi showed the worst GRS and higher effluent ADO levels than the MSC- and EV-perfused kidneys. In the EV-perfused kidneys, the tissue and effluent ATP levels and IPT were the highest, but not if CD73 was silenced. Tissue ATP content was positively correlated with tissue ADO content and negatively correlated with effluent ADO level in all groups. In conclusion, kidney conditioning with EVs protects against ischemic damage by activating the CD73/ADO system.

Keywords: CD73; adenosine; extracellular vesicles; ischemia-reperfusion injury; kidney transplantation; mesenchymal stromal cells.


Conflict of interest statement

The authors declare no conflict of interest.

Figures
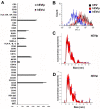
Figure 1
Figure 1
Characterization of extracellular vesicles (EVs). (A) The surface molecular profiles of hEVlp and hEVsi were determined using a multiplex bead-based flow cytometry assay with 39 multiplexed populations of dye-labeled antibody-coated capture beads. The graph shows the quantification of the median allophycocyanin (APC) fluorescence values for all bead populations after background correction (medium control values subtracted from measured EV values) of representative hEVlp and hEVsi samples (n = 3 samples analyzed with similar results). No differences were observed among the EVs obtained from human mesenchymal stromal cells (hMSCs) transfected in the presence (hEVsi) or absence (hEVlp) of a CD73-specific small interfering RNA (siRNA). (B) Representative cytofluorimetric analyses of EVs obtained from naïve hMSCs (hEVs) and from hMSCs transfected in the presence (hEVsi) or absence (hEVlp) of the specific siRNA (n = 3 samples analyzed with similar results). The black line represents the fluorescence intensity of hEVs incubated with CD73 antibody; this line is superimposable on the red line showing the fluorescence intensity of EVs obtained from lipofectamine-transfected hMSCs (hEVlp). The blue line represents the fluorescence intensity of EVs obtained from CD73-silenced hMSCs (hEVsi). (C,D) Representative graphs of nanoparticle tracking analysis showing the size distribution of (C) hEVlp and (D) hEVsi.
Figure 2
Figure 2
Characterization of rat extracellular vesicles (EVs). (A) Representative cytofluorimetric analyses of EVs obtained from rat mesenchymal stromal cells (rMSCs) transfected in the presence (rEVsi) or absence (rEVlp) of a CD73-specific small interfering RNA (siRNA) (n = 3 samples analyzed with similar results). The red line represents the fluorescence intensity of rEVlp incubated with an anti-CD73 antibody. The blue line represents the fluorescence intensity of rEVs obtained from CD73-silenced MSCs (rEVsi). The green line is the isotypic control. (B,C) Representative graphs of nanoparticle tracking analysis showing the size distribution of (B) rEVlp and (C) rEVsi (n = 3 samples analyzed with similar results).
Figure 3
Figure 3
Effects of different types of extracellular vesicles (EVs) on the proliferation of human renal proximal tubular epithelial cells (RPTECs). The effects of the following types of EVs on the proliferation of human RPTECs was assessed using bromodeoxyuridine uptake with respect to the negative control cells (CTRL−, serum-free Dulbecco modified Eagle medium): hEVs, EVs obtained from naïve human mesenchymal stromal cells (hMSCs); hEVlp, EVs obtained from hMSCs transfected in the absence of a CD73-specific small interfering RNA (siRNA); and hEVsi, EVs obtained from hMSCs transfected in the presence of CD73-specific siRNA. Cells cultured in complete medium (renal epithelial basal medium) were used as positive controls (CTRL+). Data are expressed as mean ± SD of the absorbance in 3 different experiments performed in quadruplicate. Analysis of variance with the Newman-Keuls multiple comparison test was performed: ** p < 0.001 CTRL+ vs. CTRL− and * p < 0.05 hEVs and hEVlp vs. CTRL−.
Figure 4
Figure 4
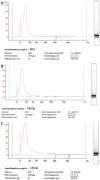
Characterization of RNA content of extracellular vesicles (EVs). Representative bioanalyzer profiles showing the size distribution of the total RNA extracted from (A) EVs obtained from naïve human mesenchymal stromal cells (hMSCs), i.e., hEVs, and EVs obtained from hMSCs transfected in the (B) absence (hEVlp) or (C) presence (hEVsi) of a CD73-specific small interfering RNA (siRNA). N = 3 samples analyzed with similar results. The first peak (left side of each panel) represents an internal standard. The EVs exhibit a relevant peak of small RNAs.
Figure 5
Figure 5
Real-time polymerase chain reaction (PCR) analyses. Analyses of the expression levels of selected microRNAs (miRNAs), specifically, hsa-let-7a, hsa-mir-21, hsa-mir-24, and hsa-mir-99a, in extracellular vesicles (EVs) from naïve human mesenchymal stromal cells (hMSCs), denoted as hEVs, and EVs from hMSCs transfected in the absence (hEVlp) or presence (hEVsi) of a CD73-specific small interfering RNA (siRNA). The data are normalized with respect to the expression level of miRNAs in hEVs. * p < 0.01 hEVs vs. hEVlp; $ p < 0.05 hEVs vs. hEVsi. N = 3 samples analyzed with similar results.
Figure 6
Figure 6
Tubular cell proliferation index. The tubular cell proliferation index (IPT) was defined as the ratio between nuclei expressing proliferating cell nuclear antigen and the total nuclei in each tubule in every field analyzed (×40). Data are expressed as mean and standard deviation. ** p < 0.01; *** p < 0.001; **** p < 0.0001. CTRL, control; MSC, mesenchymal stromal cell; EV, extracellular vesicle; αCD73, CD73-silenced group. N = 10 sections from each kidney were analyzed.
Figure 7
Figure 7
Global renal ischemic damage score. Top: Renal morphology. Periodic acid-Schiff staining of representative renal sections from the CTRL, MSC, EV, and αCD73 groups (at ×10 magnification). Bottom: Columns representing the global ischemic damage score (GRS) expressed as mean and 95% confidence interval (** p < 0.01; **** p < 0.0001). CTRL, control group; MSC, mesenchymal stromal cell group; EV, extracellular vesicle group; αCD73, CD73-silenced group. N = 20 sections from each kidney were analyzed.
Figure 8
Figure 8
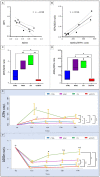
Tissue and effluent purines. (A) Negative correlation between tissue adenosine (ADO) and adenosine triphosphate (ATP) concentrations (r = −0.90, p < 0.001). (B) Positive correlation between effluent and tissue purine ratios (r = 0.94, p < 0.0001). (C) Comparison of the purine ratio in the tissues between different groups. (D) Comparison of the purine ratio in the effluent between different groups. (E) Variation in effluent ATP levels with time in each group. (F) Variation in effluent ADO levels with time in each group. The symbol at the end of the line indicates a significant difference at all time points during hypothermic perfusion. * p < 0.05; ** p < 0.01; *** p < 0.001; #T0 vs. T1h p < 0.01; Φ vs. T0 p < 0.0001; $ vs. EV T1h p < 0.01; ° vs. MSC p < 0.001. CTRL, control group; MSC, mesenchymal stromal cell group; EV, extracellular vesicle group; αCD73, CD73-silenced group; T, time since start of hypothermic perfusion (1, 2, 3, or 4 h after the start [T0] of hypothermic perfusion).
Figure 9
Figure 9
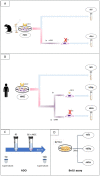
In vitro experimental design. (A) Isolation of extracellular vesicles (EVs) from rat mesenchymal stromal cells (rMSCs), naïve cells (rEVs), and CD73-silenced cells (rEVsi). (B) Isolation of EVs from human MSCs (hMSCs), naïve hMSCs (hEVs), hMSCs transfected with lipofectamine (lp; hEVlp), and CD73-silenced hMSCs (hEVsi). (C) Naïve rMSCs were incubated in Belzer solution (BS) under hypothermic conditions. At the start (T0) and after 4 hours (“h”) (Tend) of incubation, the supernatants of BS and BS + rMSCs were collected to measure the adenosine (ADO) levels. (D) Human primary renal proximal tubular epithelial cells (RPTECs) were stimulated with EVs derived from naïve hMSCs (hEVs), lp-transfected hMSCs (hEVlp), and CD73-silenced hMSCs (hEVsi). After 24 h, cell proliferation was evaluated using the bromodeoxyuridine (BrdU) assay.
Figure 10
Figure 10
Ex vivo experimental design. Donation after circulatory death was simulated by clamping the rat aorta for 20 min. Then, the kidneys were perfused for 4 hours (“h”) with Belzer solution (BS) at 4 °C (CTRL group) or with BS supplemented with 3 × 10⁶ rat mesenchymal stromal cells (rMSCs; MSC group) or extracellular vesicles (rEVs) isolated from 3 × 10⁶ rMSCs (EV group) or from 3 × 10⁶ CD73-silenced rMSCs (rEVsi; αCD73 group). During the perfusion, the effluents were collected every hour. T0 indicates the start of hypothermic perfusion, and T1h, T2h, T3h, and T4h indicate 1, 2, 3, and 4 h after the start of hypothermic perfusion. The renal tissue was collected at the end of the perfusion.

References

    1. Gregorini M., Corradetti V., Rocca C., Pattonieri E.F., Valsania T., Milanesi S., Serpieri N., Bedino G., Esposito P., Libetta C., et al. Mesenchymal Stromal Cells Prevent Renal Fibrosis in a Rat Model of Unilateral Ureteral Obstruction by Suppressing the Renin-Angiotensin System via HuR. PLoS ONE. 2016;11:e0148542. doi: 10.1371/journal.pone.0148542. - DOI - PMC - PubMed
    1. Gregorini M., Bosio F., Rocca C., Corradetti V., Valsania T., Pattonieri E.F., Esposito P., Bedino G., Collesi C., Libetta C., et al. Mesenchymal Stromal Cells Reset the Scatter Factor System and Cytokine Network in Experimental Kidney Transplantation. BMC Immunol. 2014;15:44. doi: 10.1186/s12865-014-0044-1. - DOI - PMC - PubMed
    1. Rampino T., Gregorini M., Bedino G., Piotti G., Gabanti E., Ibatici A., Sessarego N., Piacenza C., Balenzano C.T., Esposito P., et al. Mesenchymal Stromal Cells Improve Renal Injury in Anti-Thy 1 Nephritis by Modulating Inflammatory Cytokines and Scatter Factors. Clin. Sci. Lond. Engl. 1979. 2011;120:25–36. doi: 10.1042/CS20100147. - DOI - PubMed
    1. Müller L., Tunger A., Wobus M., von Bonin M., Towers R., Bornhäuser M., Dazzi F., Wehner R., Schmitz M. Immunomodulatory Properties of Mesenchymal Stromal Cells: An Update. Front. Cell Dev. Biol. 2021;9:637725. doi: 10.3389/fcell.2021.637725. - DOI - PMC - PubMed
    1. Doorn J., Moll G., Le Blanc K., van Blitterswijk C., de Boer J. Therapeutic Applications of Mesenchymal Stromal Cells: Paracrine Effects and Potential Improvements. Tissue Eng. Part B Rev. 2012;18:101–115. doi: 10.1089/ten.teb.2011.0488. - DOI - PubMed