. 2022 Sep 15;23(18):10752.
doi: 10.3390/ijms231810752.

Quantitative Analysis of Plant Cytosolic Calcium Signals in Response to Water Activated by Low-Power Non-Thermal Plasma

Affiliations

Quantitative Analysis of Plant Cytosolic Calcium Signals in Response to Water Activated by Low-Power Non-Thermal Plasma

Enrico Cortese et al. Int J Mol Sci. .

Abstract

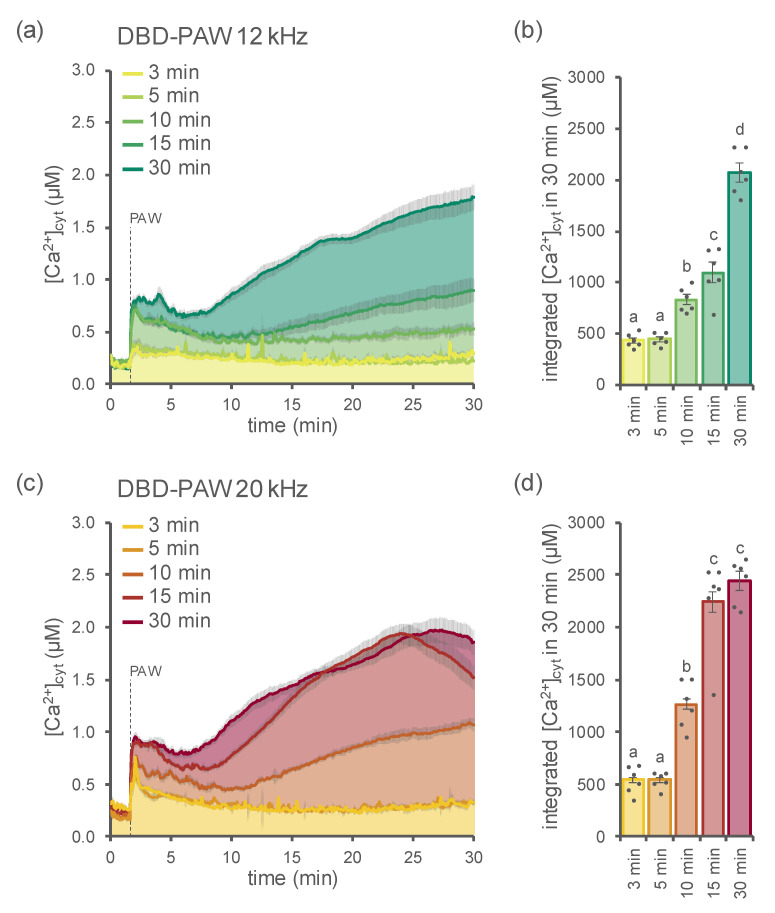
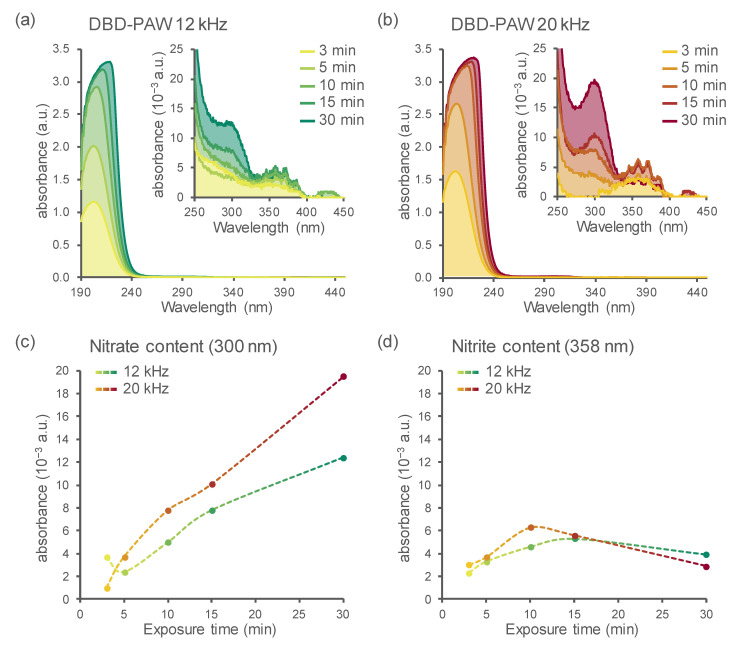
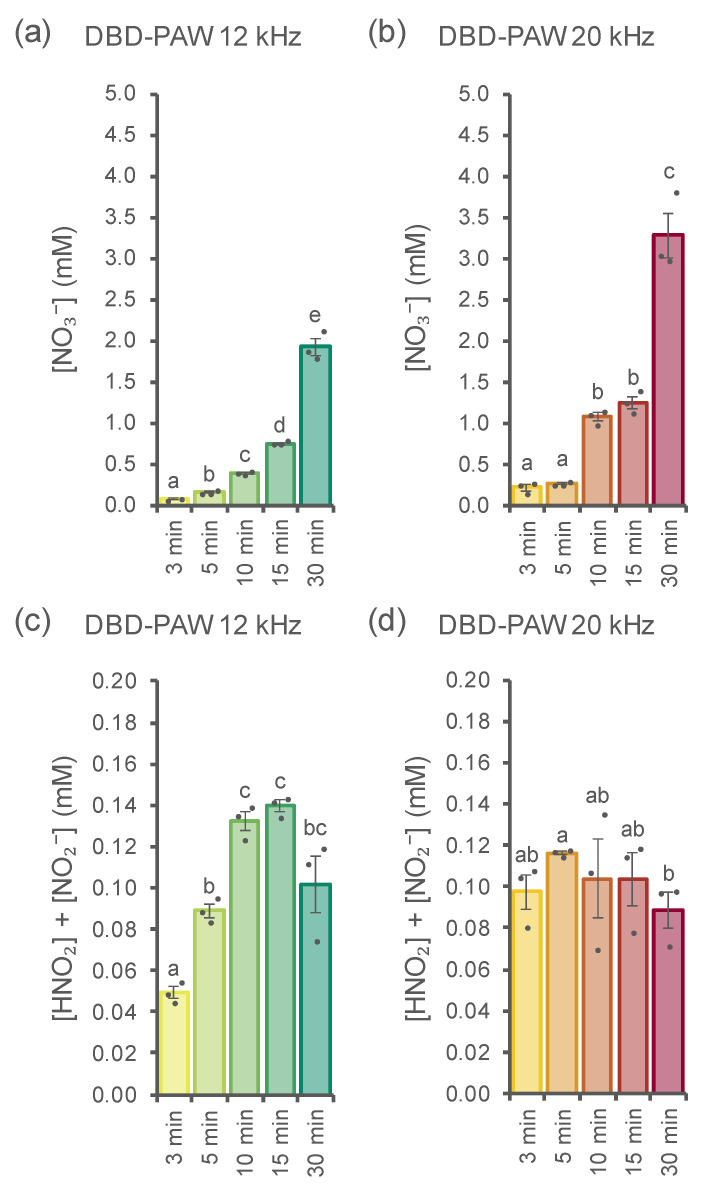
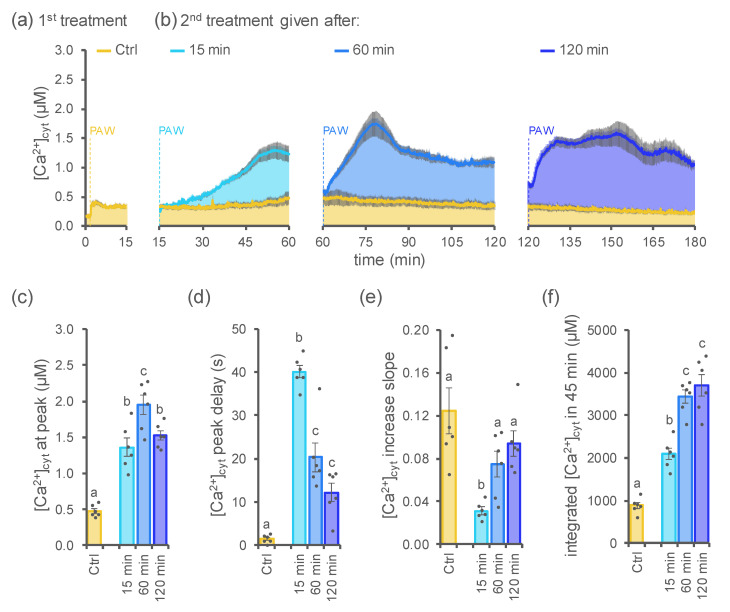
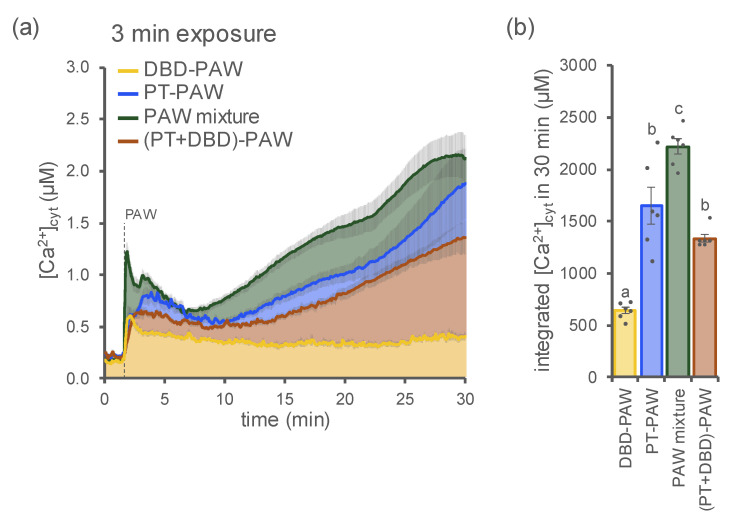
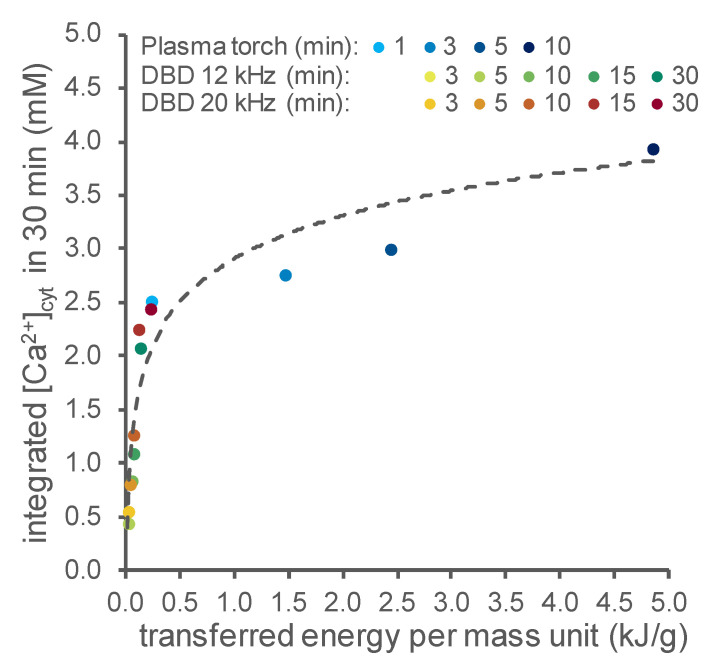
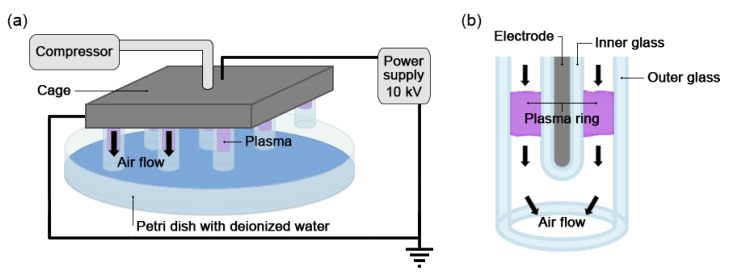
Non-thermal plasma technology is increasingly being applied in the plant biology field. Despite the variety of beneficial effects of plasma-activated water (PAW) on plants, information about the mechanisms of PAW sensing by plants is still limited. In this study, in order to link PAW perception to the positive downstream responses of plants, transgenic Arabidopsis thaliana seedlings expressing the Ca2+-sensitive photoprotein aequorin in the cytosol were challenged with water activated by low-power non-thermal plasma generated by a dielectric barrier discharge (DBD) source. PAW sensing by plants resulted in the occurrence of cytosolic Ca2+ signals, whose kinetic parameters were found to strictly depend on the operational conditions of the plasma device and thus on the corresponding mixture of chemical species contained in the PAW. In particular, we highlighted the effect on the intracellular Ca2+ signals of low doses of DBD-PAW chemicals and also presented the effects of consecutive plant treatments. The results were discussed in terms of the possibility of using PAW-triggered Ca2+ signatures as benchmarks to accurately modulate the chemical composition of PAW in order to induce environmental stress resilience in plants, thus paving the way for further applications in agriculture.

Keywords: Arabidopsis thaliana; aequorin; chemical analyses; cytosolic Ca2+ transients; dielectric barrier discharge; plant calcium signalling; plasma activated water; plasma torch.


Conflict of interest statement

The authors declare no conflict of interest.

Figures

Figure 1
Figure 1
Monitoring of cytosolic Ca2+ signals triggered in Arabidopsis thaliana (Arabidopsis) in response to DBD-PAW. Variations in the cytosolic Ca2+ concentration ([Ca2+]cyt) were measured in 1-week-old Arabidopsis seedlings stably expressing aequorin in the cytosol after the administration (at 100 s, dashed line) of 1:2 dilutions of various DBD-PAWs. The DBD’s discharge frequency was set either at 12 kHz (green shades (a,b)) or 20 kHz (red shades (c,d)); for each setting, five different DBD-PAWs were obtained by exposing deionized H2O to DBD cold plasma for increasing time intervals (from 3 to 30 min). (a,c) Data are the means (solid lines) ± SE (shading) of the [Ca2+]cyt dynamics induced in 6 independent seedlings. (b,d) Integrated [Ca2+]cyt dynamics over 30 min. Each dot represents a single biological replicate. Statistical analyses were performed according to Student’s t-test (p < 0.05), with different letters indicating significant differences.
Figure 2
Figure 2
Detection of the main nitrogen species in DBD-PAW by spectrophotometric analyses. UV–Vis spectral analyses were performed on DBD-PAWs obtained at different discharge frequencies: (a) 12 kHz (green shades); (b) 20 kHz (red shades). DBD-PAWs were obtained by progressively increasing the exposure time of deionized H2O to DBD cold plasma (from 3 to 30 min). The inset magnifications (a,b) reveal the presence of distinctive bands in the regions related to nitrates (NO3) and nitrites (NO2). Data shown in (a,b) are representative traces (solid lines and areas under the curve) of the absorbance spectra in the 190–450 nm region, which were quantified at 300 nm (c) and 358 nm (d) to provide comparative estimations for NO3 and NO2 contents among the distinct DBD-PAWs.
Figure 3
Figure 3
Quantification of the main nitrogen species in DBD-PAW. Ion chromatography analyses were performed on DBD-PAWs obtained at different discharge frequencies: (a,c) 12 kHz (green shades); (b,d) 20 kHz (red shades). DBD-PAWs were obtained by progressively increasing the exposure time of deionized H2O to the DBD cold plasma (from 3 to 30 min). Data are the means ± SE of 3 independent samples (dots). Statistical analyses were performed according to Student’s t test (p < 0.05), with different letters indicating significant differences.
Figure 4
Figure 4
Subsequent administration of DBD-PAW to Arabidopsis seedlings triggered a modified Ca2+ signature, depending on the resting time between the two treatments. Elevations in [Ca2+]cyt were measured in aequorin-expressing Arabidopsis seedlings after the administration (at 100 s, yellow dashed line) of a 1:2 dilution of DBD-PAW (a). A second equivalent dose of DBD-PAW was administered (dashed lines) at different times (b): 15 min (light blue), 60 min (blue) and 120 min (dark blue). All DBD-PAWs were obtained by exposing deionized H2O to cold plasma for 3 min, with the DBD’s discharge frequency set at 20 kHz. (a,b) Data are the means (solid lines) ± SE (shadings) of the evoked [Ca2+]cyt dynamics in 6 independent seedlings. Control seedlings (Ctrl) were subjected to only one DBD-PAW treatment. (cf) Statistical analyses of the [Ca2+]cyt peak (c), the temporal delay in the onset of the [Ca2+]cyt peak (d), the slope of the [Ca2+]cyt increase (e) and the integrated [Ca2+]cyt dynamics over 45 min (f). Each dot represents a single biological replicate. Bars labelled with different letters differ significantly (Student’s t-test, p < 0.05).
Figure 5
Figure 5
Comparison of the Ca2+ signatures induced by PAWs generated by different cold plasma sources. [Ca2+]cyt elevations were measured in aequorin-expressing Arabidopsis seedlings after the administration (at 100 s, dashed line) of PAW generated by a DBD (DBD-PAW, yellow, 1:4 dilution), PAW generated by a plasma torch (PT-PAW, blue, 1:4 dilution), a PAW mixture composed of equal volumes (1:1) of both DBD-PAW and PT-PAW (green, 1:2 dilution), a double-treated PAW obtained by sequentially exposing deionized H2O to PT and DBD cold plasmas ((PT+DBD)-PAW, brown, 1:4 dilution). All PAWs were obtained by exposing deionized H2O to cold plasma for 3 min, with the DBD’s discharge frequency set at 20 kHz. (a) Data are the means (solid lines) ± SE (shadings) of the evoked [Ca2+]cyt dynamics in 6 independent seedlings. (b) Integrated [Ca2+]cyt dynamics over 30 min. Each dot represents a single biological replicate. Statistical analyses were performed according to Student’s t-test (p < 0.05), with different letters indicating significant differences.
Figure 6
Figure 6
PAW-triggered cytosolic Ca2+ signals in Arabidopsis versus the total energy transferred to PAW. [Ca2+]cyt dynamics were measured in aequorin-expressing Arabidopsis seedlings after the administration of 1:2 dilutions of either PT-PAW (blue shades) or DBD-PAW. The DBD’s discharge frequency was set either at 12 kHz (green shades) or 20 kHz (red shades). For each set-up, various PAWs were obtained by exposing deionized H2O to cold plasma for increasing time intervals (PT-PAW: from 1 to 10 min; DBD-PAW: from 3 to 30 min). Data are the means of the integrated [Ca2+]cyt signals over 30 min in 6 independent seedlings and are plotted against the total energy per unit of mass transferred to water during the various cold plasma treatments.
Figure 7
Figure 7
(a) Scheme of the dielectric barrier discharge (DBD) device and of the experimental set-up. (b) Details of one of the 13 electrode–glass tube components.

References

    1. Berridge M.J., Lipp P., Bootman M.D. The versatility and universality of calcium signalling. Nat. Rev. Mol. Cell Biol. 2000;1:11–21. doi: 10.1038/35036035. - DOI - PubMed
    1. Clapham D.E. Calcium signaling. Cell. 2007;131:1047–1058. doi: 10.1016/j.cell.2007.11.028. - DOI - PubMed
    1. Dodd A.N., Kudla J., Sanders D. The language of calcium signaling. Annu. Rev. Plant Biol. 2010;61:593–620. doi: 10.1146/annurev-arplant-070109-104628. - DOI - PubMed
    1. Cai X., Clapham D.E. Ancestral Ca2+ signaling machinery in early animal and fungal evolution. Mol. Biol. Evol. 2012;29:91–100. doi: 10.1093/molbev/msr149. - DOI - PMC - PubMed
    1. Cai X., Wang X., Patel S., Clapham D.E. Insights into the early evolution of animal calcium signaling machinery: A unicellular point of view. Cell Calcium. 2015;57:166–173. doi: 10.1016/j.ceca.2014.11.007. - DOI - PMC - PubMed

LinkOut - more resources