. 2022 Sep 16;23(18):10791.
doi: 10.3390/ijms231810791.

Transcriptional Activation of Ecdysone-Responsive Genes Requires H3K27 Acetylation at Enhancers

Affiliations

Transcriptional Activation of Ecdysone-Responsive Genes Requires H3K27 Acetylation at Enhancers

Dong Cheng et al. Int J Mol Sci. .

Abstract

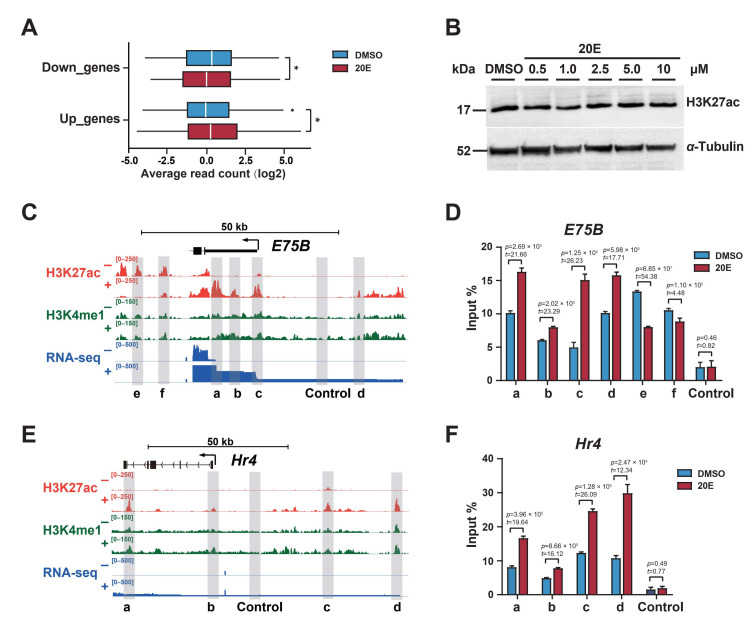
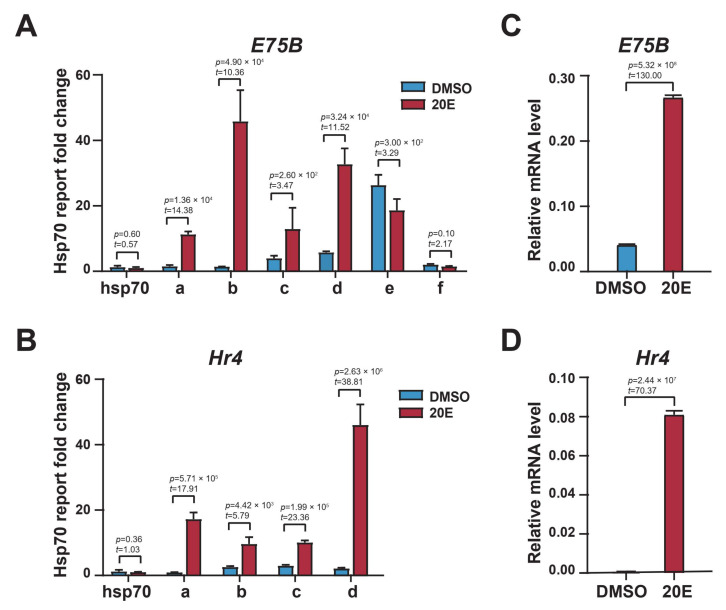
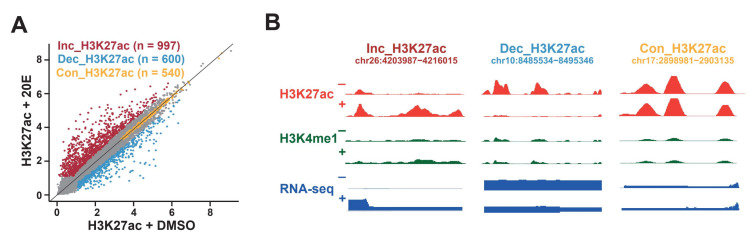
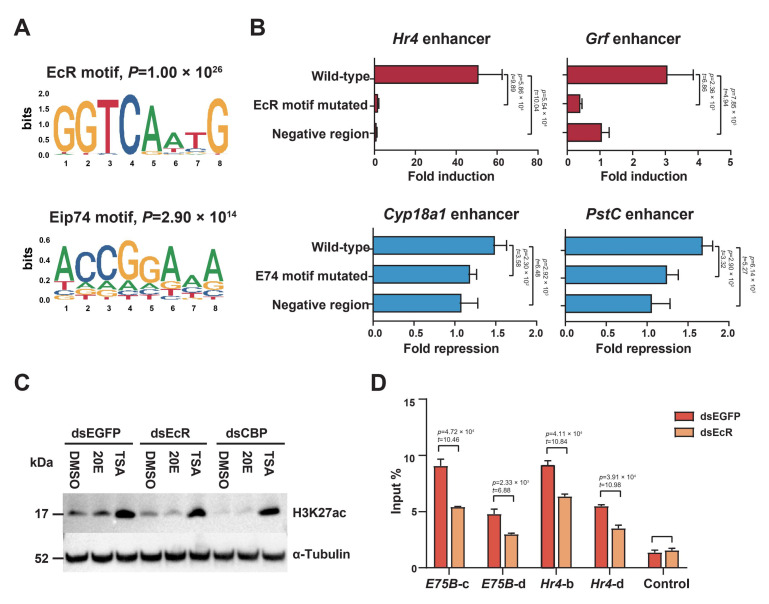
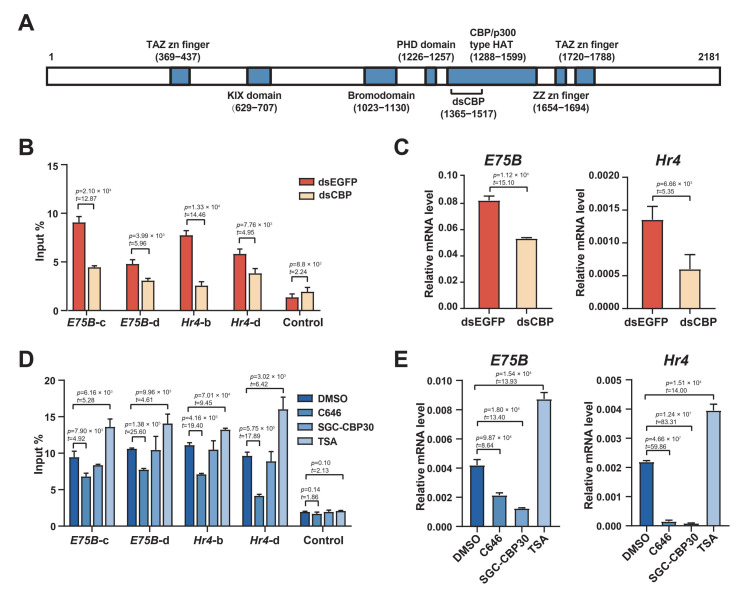
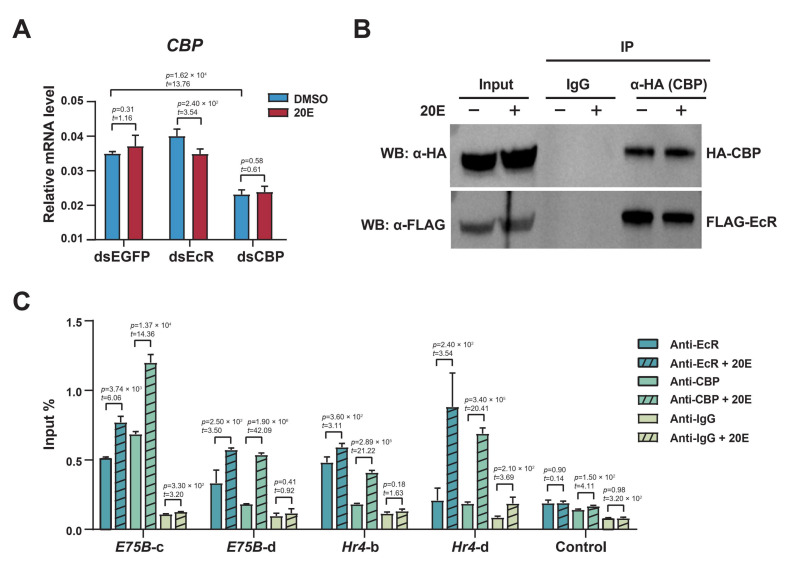
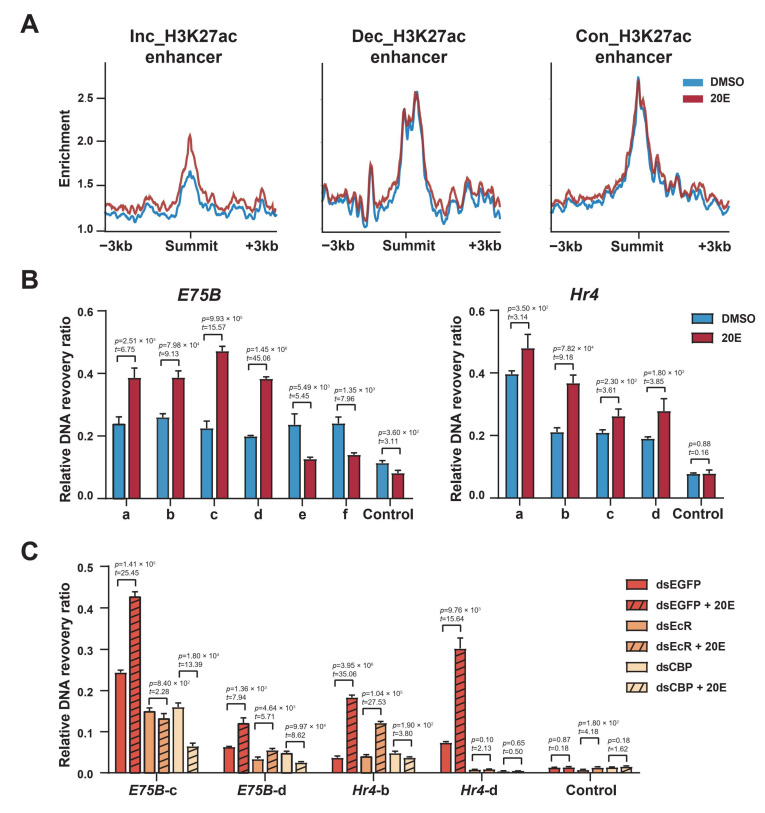
The steroid hormone ecdysone regulates insect development via its nuclear receptor (the EcR protein), which functions as a ligand-dependent transcription factor. The EcR regulates target gene expression by binding to ecdysone response elements (EcREs) in their promoter or enhancer regions. Its role in epigenetic regulation and, particularly, in histone acetylation remains to be clarified. Here, we analyzed the dynamics of histone acetylation and demonstrated that the acetylation of histone H3 on lysine 27 (H3K27) at enhancers was required for the transcriptional activation of ecdysone-responsive genes. Western blotting and ChIP-qPCR revealed that ecdysone altered the acetylation of H3K27. For E75B and Hr4, ecdysone-responsive genes, enhancer activity, and transcription required the histone acetyltransferase activity of the CBP. EcR binding was critical in inducing enhancer activity and H3K27 acetylation. The CREB-binding protein (CBP) HAT domain catalyzed H3K27 acetylation and CBP coactivation with EcR, independent of the presence of ecdysone. Increased H3K27 acetylation promoted chromatin accessibility, with the EcR and CBP mediating a local chromatin opening in response to ecdysone. Hence, epigenetic mechanisms, including the modification of acetylation and chromatin accessibility, controlled ecdysone-dependent gene transcription.

Keywords: chromatin regulation; cisregulatory elements; ecdysone receptor; gene transcription; histone modification.


Conflict of interest statement

The authors declare no conflict of interest.

Figures

Figure 1
Figure 1
Ecdysone induced dynamic changes in local H3K27 acetylation. (A) Changes in H3K27 acetylation ChIP-seq signals for the differentially expressed genes (log2 scale). The differentially expressed genes (“Up_genes” and “Down_genes”, respectively) were defined as those with at least a 1.5-fold change in expression after 20E treatment. * p < 0.05; Student’s t-test. (B) Western blotting of H3K27 acetylation levels in dimethyl sulfoxide (DMSO) or 20Etreated BmE cells. The antibodies used are shown on the right. (C) and (E) show the IGV genome browser screenshots of ChIP-seq and RNA-seq tracks for the E75B and Hr4 gene loci. Grey shading highlights putative enhancer regions. Control regions lacking enhancer chromatin were also chosen from the gene loci. + and − indicate the presence and absence of 20E treatment, respectively. (D) and (F) show the ChIP-qPCR analysis of H3K27 acetylation in DMSO or 20Etreated BmE cells. DNA was quantified using primers designed to amplify the putative regulatory elements of the E75B and Hr4 gene loci shown in (B). Error bars: standard errors of the mean (SEM) from three biological replicates measured in duplicate. Student’s t-test (t = 2.78, df = 4).
Figure 2
Figure 2
H3K27 acetylation was required for E75B and Hr4 enhancer activity and mRNA expression. (A,B) Functional testing of enhancers in DMSO or 20Etreated BmE cells via luciferase assays. Enhancers were cloned using primers designed to amplify the putative regulatory elements of E75B and Hr4 loci. The changes shown were fold increases over the pGL3 reporter backbone with the hsp70 core promoter. (C,D) RT–qPCR of E75B and Hr4 expression in DMSO- or 20E-treated BmE cells. We calculated the ratios of the RNA levels of the gene of interest to those of RP49 in DMSO- and 20E-treated cells. Error bars: standard error of the mean (SEM) from three biological replicates measured in duplicate. Student’s t-test (df = 4).
Figure 3
Figure 3
Enhancers were categorized based on changes in H3K27 acetylation. (A) Enhancer categorization based on H3K27 acetylation signals in response to 20E treatment. H3K27 acetylation signals were taken from the normalized H3K27 acetylation ChIP-seq reads within a 1.5 kb window centered on each enhancer. Inc, increasing; Con, constant; Dec, decreasing. (B) IGV genome browser screenshots of ChIP-seq and RNA-seq tracks for representative loci demonstrating distinct H3K27 acetylation dynamics at enhancers in response to 20E treatment. + and − indicate the presence or absence of 20E treatment, respectively.
Figure 4
Figure 4
Ecdysone receptor (EcR) played a critical role in inducing enhancer activity. (A) Upper and lower panels: de novo motif analysis of enhancers with increasing or decreasing H3K27 acetylation, respectively. The most enriched motif is shown. (B) Luciferase assays for the enhancer categories in DMSO- or 20E-treated BmE cells. Fold induction of the normalized luciferase signal for the H3K27 acetylation-increasing enhancers near Hr4 and Grf assessing wild-type sequences and EcR-motif-mutated variants. Fold repression of normalized luciferase signal for H3K27 acetylation-decreasing enhancers near Cyp18a1 and PstC assessing wild-type and Eip74-motif-mutated variants, in which the enhancer did not contain an EcR motif. Negative region: sequence from the Hr4 control region, as in Figure 1E. The DNA sequences are listed in Supplementary Table S2. Student’s t-test (df = 4). (C) Western blotting of protein extracts of BmE cells first treated with dsRNA against EGFP, EcR, or CBP, then either left untreated or exposed to 20E or TSA for 12 h. The antibodies used are shown on the right. (D) ChIP-qPCR of H3K27 acetylation in BmE cells treated with dsRNA against EGFP or EcR. DNA was quantified using primers designed to amplify the enhancer regions of E75B and Hr4 gene loci, as shown in Figure 1C,E. Error bars: standard error of the mean (SEM) from three biological replicates measured in duplicate. Student’s t-test (df = 4).
Figure 5
Figure 5
CBP HAT activity was critical for ecdysone-responsive gene expression. (A) Scheme of CBP organization, indicating the main functional motifs and the sites targeted by the dsRNA. Length is proportional to the lengths of amino acids. (B) ChIP-qPCR of H3K27 acetylation in BmE cells treated with dsRNA against EGFP or CBP. DNA was quantified using primers designed to amplify the enhancer regions of E75B and Hr4 gene loci, as shown in Figure 1C,E. Error bars: standard error of the mean (SEM) from three biological replicates measured in duplicate. Student’s t-test (df = 4). (C) RT–qPCR analysis of E75B and Hr4 expression in BmE cells treated with dsRNA against EGFP or CBP. Ratios of RNA levels of the gene of interest to RP49 RNA levels were calculated. Error bars: standard error of the mean (SEM) from three biological replicates measured in duplicate. Student’s t-test (df = 4). (D) ChIP-qPCR of H3K27 acetylation in BmE cells treated with DMSO, C646 (a CBP HAT domain-specific inhibitor), SGC-CBP30 (a CBP-bromodomain-specific inhibitor), or trichostatin A (TSA, a HDAC inhibitor), respectively. The DNA was quantified using primers designed to amplify the enhancer regions of E75B and Hr4 gene loci, as shown in Figure 1C,E. Error bars: standard error of the mean (SEM) from three biological replicates measured in duplicate. Student’s t-test (df = 4). (E) RT-qPCR of E75B and Hr4 expression in BmE cells treated with DMSO, C646, SGC-CBP30, and TSA, respectively. We calculated the ratios of the RNA levels of the gene of interest to those of RP49. Error bars: standard error of the mean (SEM) from three biological replicates measured in duplicate. Student’s t-test (df = 4).
Figure 6
Figure 6
Ecdysone receptor (EcR) cooperated with CBP-mediated histone acetylation in response to 20E. (A) RT-qPCR of CBP expression in BmE cells first treated with dsRNA against EGFP, EcR, or CBP, then either left untreated or exposed to 20E for 12 h. We calculated the ratios of RNA levels of the gene of interest to those of RP49. Error bars: standard error of the mean (SEM) from three biological replicates measured in duplicate. Student’s t-test (df = 4). (B) CBP interacted with EcR in the presence of 20E. DMSO- or 20E-treated BmE cells were cotransfected with HA-CBP and FLAG-EcR. Extracts were immunoprecipitated with HA (using the HA IP antibody). The immunoprecipitates were analyzed via Western blotting. (C) ChIP-qPCR analysis of EcR, CBP, and IgG in DMSO- or 20E-treated BmE cells. DNA was quantified using primers designed to amplify the putative regulatory elements of E75B and Hr4 gene loci, as shown in Figure 1C,E. Error bars: standard error of the mean (SEM) from three biological replicates measured in duplicate. Student’s t-test (df = 4).
Figure 7
Figure 7
Ecdysone signaling can target inaccessible chromatin. (A) FAIRE-seq read density profiles ±3 kb around the summits of enhancers from the three enhancer categories before and after 20E treatment (blue and orange, respectively). Inc_H3K27ac, Dec_H3K27ac, and Con_H3K27ac: increasing, decreasing, and constant H3K27 acetylation, respectively. (B) Nucleosome density assayed via FAIRE-qPCR in BmE cells treated with DMSO or 20E. The relative DNA recovery ratio between free versus total DNA was calculated and plotted. DNA was quantified using primers designed to amplify the putative regulatory elements of E75B and Hr4 gene loci. Error bars: standard errors of the mean (SEM) from three biological replicates measured in duplicate. Student’s t-test (df = 4). (C) Nucleosome density assayed via FAIRE-qPCR in BmE cells first treated with dsRNA against EGFP, EcR, or CBP, then either left untreated or exposed to 20E for 12 h. The relative DNA recovery ratio between free versus total DNA was calculated and plotted. DNA was quantified using primers designed to amplify the putative regulatory elements of E75B and Hr4 gene loci, as shown in Figure 1C,E. Error bars: standard error of the mean (SEM) from three biological replicates measured in duplicate. Student’s t-test (df = 4).

Similar articles

Cited by

References

    1. Yamanaka N., Rewitz K.F., O’Connor M.B. Ecdysone control of developmental transitions: Lessons from Drosophila research. Annu. Rev. Entomol. 2013;58:497–516. doi: 10.1146/annurev-ento-120811-153608. - DOI - PMC - PubMed
    1. Schwedes C.C., Carney G.E. Ecdysone signaling in adult Drosophila melanogaster. J. Insect Physiol. 2012;58:293–302. doi: 10.1016/j.jinsphys.2012.01.013. - DOI - PubMed
    1. Hill R.J., Billas I.M., Bonneton F., Graham L.D., Lawrence M.C. Ecdysone receptors: From the Ashburner model to structural biology. Annu. Rev. Entomol. 2013;58:251–271. doi: 10.1146/annurev-ento-120811-153610. - DOI - PubMed
    1. Aranda A., Pascual A. Nuclear hormone receptors and gene expression. Physiol. Rev. 2001;81:1269–1304. doi: 10.1152/physrev.2001.81.3.1269. - DOI - PubMed
    1. Nishita Y. Ecdysone response elements in the distal promoter of the Bombyx Broad-Complex gene, BmBR-C. Insect Mol. Biol. 2014;23:341–356. - PubMed

LinkOut - more resources