. 2022 Sep 16;23(18):10820.
doi: 10.3390/ijms231810820.

Use of a Molecular Switch Probe to Activate or Inhibit GIRK1 Heteromers In Silico Reveals a Novel Gating Mechanism

Affiliations

Use of a Molecular Switch Probe to Activate or Inhibit GIRK1 Heteromers In Silico Reveals a Novel Gating Mechanism

Dimitrios Gazgalis et al. Int J Mol Sci. .

Abstract

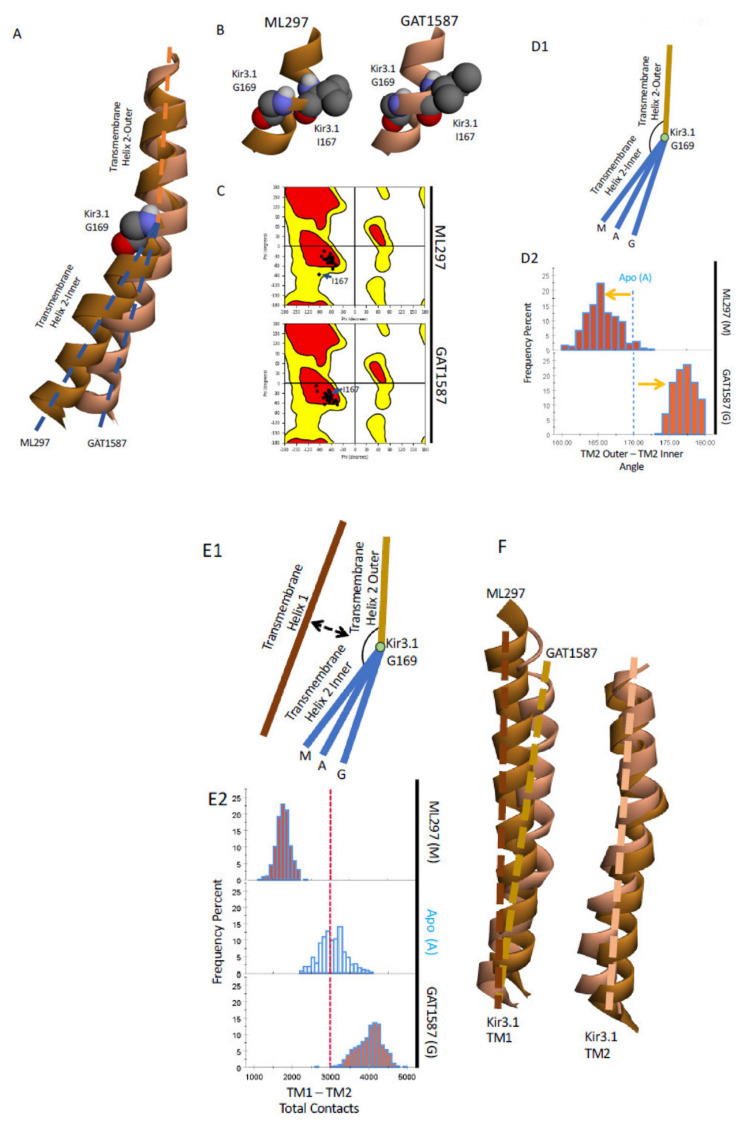
G protein-gated inwardly rectifying K+ (GIRK) channels form highly active heterotetramers in the body, such as in neurons (GIRK1/GIRK2 or GIRK1/2) and heart (GIRK1/GIRK4 or GIRK1/4). Based on three-dimensional atomic resolution structures for GIRK2 homotetramers, we built heterotetrameric GIRK1/2 and GIRK1/4 models in a lipid bilayer environment. By employing a urea-based activator ML297 and its molecular switch, the inhibitor GAT1587, we captured channel gating transitions and K+ ion permeation in sub-microsecond molecular dynamics (MD) simulations. This allowed us to monitor the dynamics of the two channel gates (one transmembrane and one cytosolic) as well as their control by the required phosphatidylinositol bis 4-5-phosphate (PIP2). By comparing differences in the two trajectories, we identify three hydrophobic residues in the transmembrane domain 1 (TM1) of GIRK1, namely, F87, Y91, and W95, which form a hydrophobic wire induced by ML297 and de-induced by GAT1587 to orchestrate channel gating. This includes bending of the TM2 and alignment of a dipole of two acidic GIRK1 residues (E141 and D173) in the permeation pathway to facilitate K+ ion conduction. Moreover, the TM movements drive the movement of the Slide Helix relative to TM1 to adjust interactions of the CD-loop that controls the gating of the cytosolic gate. The simulations reveal that a key basic residue that coordinates PIP2 to stabilize the pre-open and open states of the transmembrane gate flips in the inhibited state to form a direct salt-bridge interaction with the cytosolic gate and destabilize its open state.

Keywords: GIRK1 heterotetramer; MD simulations; ML297; PIP2; TM1 hydrophobic wire.


Conflict of interest statement

The authors declare no conflict of interest.

Figures

Figure 1
Figure 1
Pharmacological actions of a molecular switch moiety are reproduced in sub-microsecond MD simulations in GIRK1/2. (A) The structures of GIRK1 specific modulators ML297, GAT1587, and the site of molecular switching region (off the pyrazole ring) that controls compound activity. (B) Equilibrium binding site for ML297 and GAT1587 following a 300 ns stochastic dynamics simulation in complex with PIP2 and GIRK1/2. (C) Ion permeation pathway for a single ion taken from the ML297-PIP2-GIRK1/2 simulation. (DF) Ions conducted, minimum gate distances, and normalized salt-bridge formation over the last 150 ns of the simulations are shown.
Figure 2
Figure 2
GAT1587 binding site along the TM helices in the GIRK1/2 heterotetramer.(A) Equilibrium binding pose for ML297 when complexed with PIP2 GIRK1/2 after 300 ns of stochastic dynamics. (B) A 2D schematic representation of the compound’s binding pose depicting protein ligand interactions. (C) Equilibrium binding pose for GAT1587 when complexed with PIP2 GIRK1/2 after 300 ns of stochastic dynamics. (D) A 2D schematic representation of the compounds binding pose depicting protein ligand interactions.
Figure 3
Figure 3
ML297 decreases and GAT1587 increases the angle between the outer and inner TM2 segments on each side of the flexible GIRK1-G169. (A) Comparison between TM2 of the ML297 (dark orange) and the GAT1587 (light orange) complexed with the GIRK1/2 systems. (B) The two hinge points that allow for TM2 bending. (C) Ramachandran plots for residues within TM2. I167 is highlighted in both. (D) Schematic representation of the movements of TM2 and a quantification of the bending around GIRK1-G169. (E) Expanded model including the nearby TM1 and a quantification of these effects. (F) Relative movements of the two transmembrane helices.
Figure 4
Figure 4
A hydrophobic wire (W95-Y91-F87) couples TM1 to TM2 at the level of the HBC gate (M180) and is stabilized by ML297 but not by GAT1587 to regulate the E141/D173-dependent conduction. (A) Protein structure with the pi-stack along TM1 highlighted. (B) Interaction distributions in the presence of ML297 or GAT1587. Pink denotes pi–pi interactions with an upper cutoff of 4 angstroms. Light pink denotes Van der Waals interactions with an upper cutoff of 3 angstroms. (C) Protein structure with the stabilizing hydrophobic residues of the GIRK2 subunit that can interact with the TM1 hydrophobic wire residues. (D) Interaction distance distributions of hydrophobic residues involved when either ML297 or GAT1587 is present. Light pink denotes Van der Waals interactions with an upper cutoff of 3 angstroms. (E) Protein structure (E1) with acidic residues that interact with a potassium ion (highlighted interactions) (E2). Dotted lines indicate a broken interaction between residues. The solid lines indicate the formation of an interaction. (F) Interaction distance distributions of TM1 hydrophobic chain residues with the two residues of the dipole between D141 and D173 of GIRK1 and S181 (next to G180) of GIRK2 in the presence of ML297 or GAT1587. Light green denotes dipole integrations with an upper cutoff of 4 angstroms. (G) Schematic representation of the charge relay network between W95 and Y91 of the TM1 hydrophobic chain with the two acidic residues.
Figure 4
Figure 4
A hydrophobic wire (W95-Y91-F87) couples TM1 to TM2 at the level of the HBC gate (M180) and is stabilized by ML297 but not by GAT1587 to regulate the E141/D173-dependent conduction. (A) Protein structure with the pi-stack along TM1 highlighted. (B) Interaction distributions in the presence of ML297 or GAT1587. Pink denotes pi–pi interactions with an upper cutoff of 4 angstroms. Light pink denotes Van der Waals interactions with an upper cutoff of 3 angstroms. (C) Protein structure with the stabilizing hydrophobic residues of the GIRK2 subunit that can interact with the TM1 hydrophobic wire residues. (D) Interaction distance distributions of hydrophobic residues involved when either ML297 or GAT1587 is present. Light pink denotes Van der Waals interactions with an upper cutoff of 3 angstroms. (E) Protein structure (E1) with acidic residues that interact with a potassium ion (highlighted interactions) (E2). Dotted lines indicate a broken interaction between residues. The solid lines indicate the formation of an interaction. (F) Interaction distance distributions of TM1 hydrophobic chain residues with the two residues of the dipole between D141 and D173 of GIRK1 and S181 (next to G180) of GIRK2 in the presence of ML297 or GAT1587. Light green denotes dipole integrations with an upper cutoff of 4 angstroms. (G) Schematic representation of the charge relay network between W95 and Y91 of the TM1 hydrophobic chain with the two acidic residues.
Figure 5
Figure 5
The ML297-induced SH movement, as a result of the TM1 movement, drives changes in the CD loop interactions causing stabilization of the G-loop in the open conformation through its residue GIRK2-E315.2 liberating K188.1 that coordinates PIP2 to stabilize the HBC gate in the open conformation. (A) A model of how TM1 modulates the slide helix (A1) and a quantification of these effects (A2). (B) Relative movements of the activated and inhibited SH regions. (C) Protein structure (C1) with residues that link the SH to the CD loop (C2). (D) Distance distributions of key residues that drive the channel into the active state. Dark yellow denotes charge–charge interactions with an upper cutoff of 4.0 angstroms. Light green denotes dipole charge interactions with an upper cut off of 4.0 angstroms. (E) Schematic outline of the changes in key residue interactions. (F) Protein structure (F1) with residues that link the SH to the CD loop (F2). (G) Distance distributions of residues that drive the channel into the active state. Dark yellow denotes charge–charge interactions with an upper cutoff of 4.0 angstroms. Pink denotes dipole charge interactions with an upper cutoff of 4.0 angstroms.
Figure 5
Figure 5
The ML297-induced SH movement, as a result of the TM1 movement, drives changes in the CD loop interactions causing stabilization of the G-loop in the open conformation through its residue GIRK2-E315.2 liberating K188.1 that coordinates PIP2 to stabilize the HBC gate in the open conformation. (A) A model of how TM1 modulates the slide helix (A1) and a quantification of these effects (A2). (B) Relative movements of the activated and inhibited SH regions. (C) Protein structure (C1) with residues that link the SH to the CD loop (C2). (D) Distance distributions of key residues that drive the channel into the active state. Dark yellow denotes charge–charge interactions with an upper cutoff of 4.0 angstroms. Light green denotes dipole charge interactions with an upper cut off of 4.0 angstroms. (E) Schematic outline of the changes in key residue interactions. (F) Protein structure (F1) with residues that link the SH to the CD loop (F2). (G) Distance distributions of residues that drive the channel into the active state. Dark yellow denotes charge–charge interactions with an upper cutoff of 4.0 angstroms. Pink denotes dipole charge interactions with an upper cutoff of 4.0 angstroms.
Figure 6
Figure 6
Overview of residue interactions driving the pre-open Apo channel state to the ML297-induced open conformation versus the GAT1587-induced close conformation. (A) A summary of the interaction networks that control channel function located near the compound binding site. (B) Outline of key changes affecting G loop open-state stabilization or a key Lys that coordinates PIP2 to open the HBC gate.

References

    1. Logothetis D.E., Petrou V.I., Zhang M., Mahajan R., Meng X.Y., Adney S.K., Cui M., Baki L. Phosphoinositide control of membrane protein function: A frontier led by studies on ion channels. Annu. Rev. Physiol. 2015;77:81–104. doi: 10.1146/annurev-physiol-021113-170358. - DOI - PMC - PubMed
    1. Logothetis D.E., Kurachi Y., Galper J., Neer E.J., Clapham D.E. The βγ subunits of GTP-binding proteins activate the muscarinic K+ channel in heart. Nature. 1987;325:321–326. doi: 10.1038/325321a0. - DOI - PubMed
    1. Reuveny E., Slesinger P.A., Inglese J., Morales J.M., Iñiguez-Lluhi J.A., Lefkowitz R.J., Bourne H.R., Jan Y.N., Jan L.Y. Activation of the cloned muscarinic potassium channel by G protein βγ subunits. Nature. 1994;370:143–146. doi: 10.1038/370143a0. - DOI - PubMed
    1. Sui J.L., Petit-Jacques J., Logothetis D.E. Activation of the atrial KACh channel by the βγ subunits of G proteins or intracellular Na+ ions depends on the presence of phosphatidylinositol phosphates. Proc. Natl. Acad. Sci. USA. 1998;95:1307–1312. doi: 10.1073/pnas.95.3.1307. - DOI - PMC - PubMed
    1. Petit-Jacques J., Sui J.L., Logothetis D.E. Synergistic activation of G protein-gated inwardly rectifying potassium channels by the βγ subunits of G proteins and Na+ and Mg2+ ions. J. Gen. Physiol. 1999;114:673–684. doi: 10.1085/jgp.114.5.673. - DOI - PMC - PubMed

MeSH terms

LinkOut - more resources