. 2022 Sep 16;23(18):10827.
doi: 10.3390/ijms231810827.

Multiple Parallel Fusion Network for Predicting Protein Subcellular Localization from Stimulated Raman Scattering (SRS) Microscopy Images in Living Cells

Affiliations

Multiple Parallel Fusion Network for Predicting Protein Subcellular Localization from Stimulated Raman Scattering (SRS) Microscopy Images in Living Cells

Zhihao Wei et al. Int J Mol Sci. .

Abstract

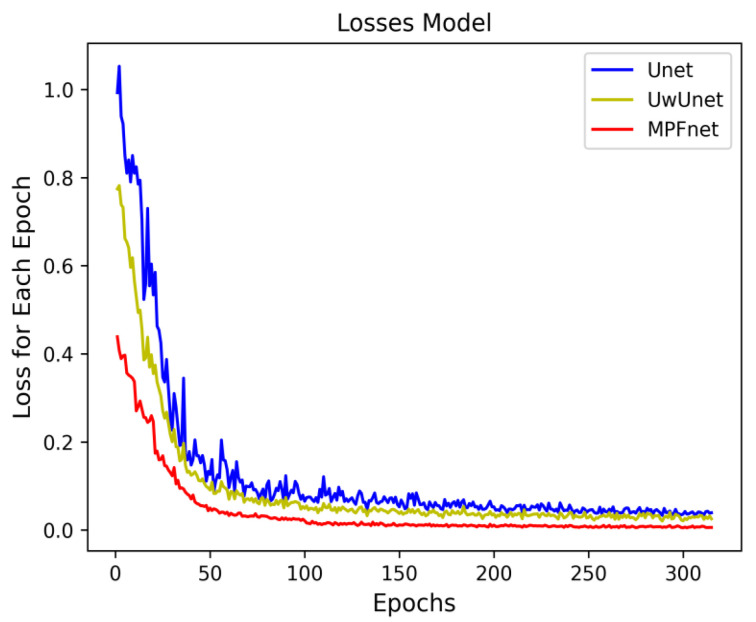
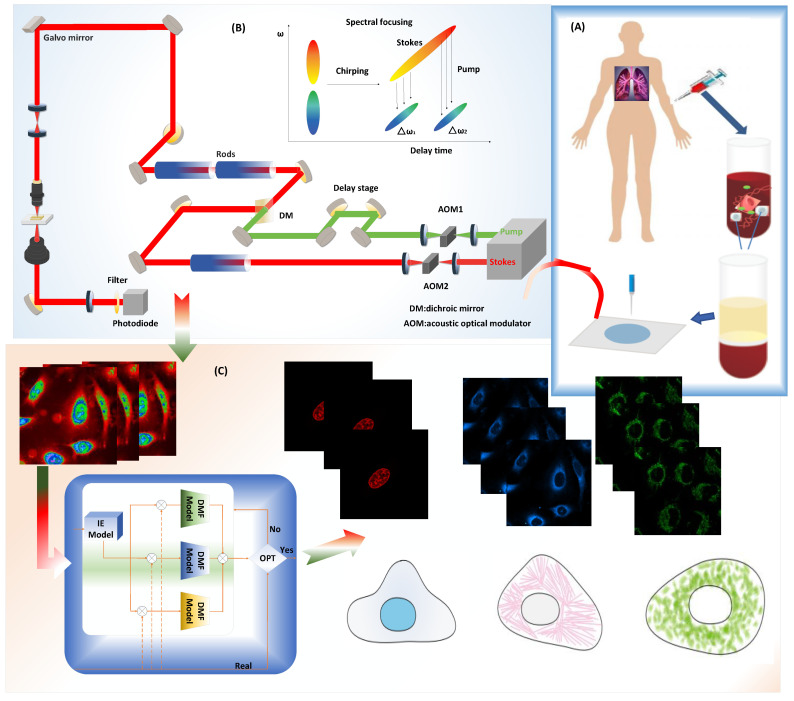
Stimulated Raman Scattering Microscopy (SRS) is a powerful tool for label-free detailed recognition and investigation of the cellular and subcellular structures of living cells. Determining subcellular protein localization from the cell level of SRS images is one of the basic goals of cell biology, which can not only provide useful clues for their functions and biological processes but also help to determine the priority and select the appropriate target for drug development. However, the bottleneck in predicting subcellular protein locations of SRS cell imaging lies in modeling complicated relationships concealed beneath the original cell imaging data owing to the spectral overlap information from different protein molecules. In this work, a multiple parallel fusion network, MPFnetwork, is proposed to study the subcellular locations from SRS images. This model used a multiple parallel fusion model to construct feature representations and combined multiple nonlinear decomposing algorithms as the automated subcellular detection method. Our experimental results showed that the MPFnetwork could achieve over 0.93 dice correlation between estimated and true fractions on SRS lung cancer cell datasets. In addition, we applied the MPFnetwork method to cell images for label-free prediction of several different subcellular components simultaneously, rather than using several fluorescent labels. These results open up a new method for the time-resolved study of subcellular components in different cells, especially cancer cells.

Keywords: deep learning; label-free live cell imaging; multiple parallel fusion network; nonlinear optical microscopy; protein subcellular localization.


Conflict of interest statement

The authors declare no conflict of interest.

Figures

Figure 1
Figure 1
The neural network training curves for three prediction models include Unet, UwUnet, and MPFnet.
Figure 2
Figure 2
Subcellular localization prediction results of differentiation model from label-free cell imaging experiments. The results for different organelle locations, including nuclei (second column), mitochondria (third column), and endoplasmic reticulum (right) from the single raw SRS imaging cell (left), are shown in (A). The prediction results for organelle locations, including nuclei (top row), mitochondria (third column), and endoplasmic reticulum (bottom row), from the raw SRS imaging cells (left) are shown in (B). Scale bar, 25 μm.
Figure 3
Figure 3
Predicted organelle fluorescence from hyperspectral SRS microscopy images by using UwUNet, U-Net, and MPFNet methods. The first column shows the Input SRS image, the second column shows the ground-truth fluorescence image, and the following three columns display the predicted fluorescence results by UwUNet, U-Net, and MPFNet, respectively, for nuclei (top), mitochondria (middle), and endoplasmic reticulum (bottom). Scale bar, 25 μm.
Figure 4
Figure 4
(a) Mean pixel accuracy comparison among different methods. Purple dash line, red dot line, and blue dash-dot line represent MPFnet, UwUnet, and Unet models, respectively. (b) Radar chart for quantitative comparisons of different predictive models.
Figure 5
Figure 5
Comparing dice performance among various prediction algorithms. (a) Dice similarity coefficient radar chart for quantitative comparisons of different predictive models. (b) Box plot of dice values for all organelles (nuclei, mitochondria, and endoplasmic reticulum) prediction task set with MPFnet-based learning model and compared with that of varied deep neural network-based prediction models, such as Unet and UwUnet learning model on all. (c) Box plot of dice coefficient value on nuclei prediction task set with MPFnet-based learning model and compared with that of varied deep neural network-based prediction models, such as Unet and UwUnet learning model. (d) Box plot of dice coefficient value on endoplasmic reticulum prediction task set with MPFnet-based learning model and compared with that of varied deep neural network-based prediction models, such as Unet and UwUnet learning model. (e) Box plot of dice values on mitochondria prediction task set with MPFnet-based learning model and compared with that of varied deep neural network-based prediction models, such as Unet and UwUnet learning model.
Figure 6
Figure 6
The mean intersection over union (mIOU) of different deep learning models over all SRS microscopy images in fixed lung cancer cells (A549, from ATCC) detection dataset. (a) mIOU for each epoch comparison among different methods. Unet (Purple triangle dash line), UwUnet (Green circle solid line), MPFnet (Pink arrow dotted line) represent Unet, UwUnet, MPFnet, respectively. (b) Box plot of mIOU accuracy of all organelles (nuclei, mitochondria, and endoplasmic reticulum) prediction task set with MPFnet-based learning model and compared with that of varied deep neural network-based prediction models, such as Unet and UwUnet learning models. (c) Box plot of mIOU accuracy on nuclei prediction task set with MPFnet-based learning model and compared with that of varied deep neural network-based prediction models such as Unet and UwUnet learning model. (d) Box plot of mIOU accuracy on endoplasmic reticulum prediction task set with MPFnet-based learning model and compared with that of varied deep neural network-based prediction models such as Unet and UwUnet learning model on all. (e) Box plot of mIOU accuracy on mitochondria prediction task set with MPFnet-based learning model and compared with that of varied deep neural network-based prediction models such as Unet and UwUnet learning models.
Figure 7
Figure 7
Comparing PCC performance among various prediction algorithms. (a) PCC radar chart for quantitative comparisons of different predictive models. (b) Box plot of PCC value over all organelle (nuclei, mitochondria, and endoplasmic reticulum) prediction task sets with MPFnet-based learning model and compared with that of varied deep neural network-based prediction models, such as Unet and UwUnet learning model. (c) Box plot of PCC value on nuclei prediction task set with MPFnet-based learning model and compared with that of varied deep neural network-based prediction models such as Unet and UwUnet learning model. (d) Box plot of PCC values on endoplasmic reticulum prediction task set with MPFnet-based learning model and compared with that of varied deep neural network-based prediction models such as Unet and UwUnet learning models. (e) Box plot of PCC values on mitochondria prediction task set with MPFnet-based learning model and compared with that of varied deep neural network-based prediction models such as Unet and UwUnet learning model.
Figure 8
Figure 8
Comparing NRMSE performance among various prediction algorithms. (a) NRMSE radar chart for quantitative comparisons of different predictive models. (b) Box plot of NRMSE value over all organelles (nuclei, mitochondria, and endoplasmic reticulum) prediction task set with MPFnet-based learning model and compared with that of varied deep neural network-based prediction models such as Unet and UwUnet learning models. (c) Box plot of NRMSE value on nuclei prediction task set with MPFnet-based learning model and compared with that of varied deep neural network-based prediction models such as Unet and UwUnet learning model. (d) Box plot of NRMSE values on endoplasmic reticulum prediction task set with MPFnet-based learning model and compared with that of varied deep neural network-based prediction models such as Unet and UwUnet learning model. (e) Box plot of NRMSE values on mitochondria prediction task set with MPFnet-based learning model and compared with that of varied deep neural network-based prediction models such as Unet and UwUnet learning model.
Figure 9
Figure 9
Comparing SSIM performance among various prediction algorithms. (a) The SSIM performance measures typical of predictive tasks. (b) Box plot of SSIM values in all organelle (nuclei, mitochondria, and endoplasmic reticulum) prediction task sets with the MPFnet-based learning model and compared with that of varied deep neural network-based prediction models such as Unet and UwUnet. Box plot of SSIM values on (c) nuclei, (d) endoplasmic reticulum, and (e) mitochondria prediction task sets with MPFnet-based learning model and compared with that of varied deep neural network-based prediction models such as Unet and UwUnet learning model.
Figure 10
Figure 10
Comparison of the protein subcellular localization results from raw cell images (first column) among various prediction algorithms, including Unet (second column), UwUnet (third column), and MPFnent (fourth column). Local feature regions (red box), global representations (green box). Scale bar, 25 µm.
Figure 11
Figure 11
Workflow of the Single-Cell experiment by Stimulated Raman Scattering Imaging and deep learning model prediction process. (A) The process of prepearing the lung cancer cell sample. (B) Stimulated Raman Scattering microscopy setup for collecting SRS signal of the lung cancer cell samples. (C) Different machine learning techniques for the subcellular protein localization of lung cancer cells.
Figure 12
Figure 12
Graphical overview of our proposed deep MPF architecture. It includes five Modules: Input SRS imagings, Fluorescent Imaging Channels, Trained Model, Optimization and Predicted Output.
Figure 13
Figure 13
Multiple Parallel Fusion Deep Networks for the Protein Subcellular Localization from Label-free live cell imaging.
Figure 14
Figure 14
Multiple Parallel Fusion Model for the Protein Subcellular Localization from Label-free live cell imaging.
Figure 15
Figure 15
Diagram of spatial attention sub-module. As illustrated, the spatial sub-module utilizes max-pooling outputs and average-pooling outputs that are pooled along the channel axis and forwarded to a convolution layer.
Figure 16
Figure 16
A structure scheme of the Channel-wise Attention based on squeeze-excitation block.
Figure 17
Figure 17
The structure of the attention gate block to highlight the significant information of the down-sampling output.

Similar articles

Cited by

References

    1. Parlakgül G., Arruda A.P., Pang S., Erika C., Nina M., Ekin G., Grace Y.L., Karen I., Hess H.F., Shan X.C., et al. Regulation of liver subcellular architecture controls metabolic homeostasis. Nature. 2022;603:736–742. doi: 10.1038/s41586-022-04488-5. - DOI - PMC - PubMed
    1. Mottis A., Herzig S., Auwerx J. Mitocellular communication: Shaping health and disease. Science. 2019;366:827–832. doi: 10.1126/science.aax3768. - DOI - PubMed
    1. Yuan H., Cai L., Wang Z.Y., Hu X., Zhang S.T., Ji S.W. Computational Modeling of Cellular Structures Using Conditional Deep Generative Networks. Bioinformatics. 2019;35:2141–2149. doi: 10.1093/bioinformatics/bty923. - DOI - PubMed
    1. Koenig F., Knittel J., Stepp H. Diagnosing cancer in vivo. Science. 2001;292:401–1403. doi: 10.1126/science.292.5520.1401. - DOI - PubMed
    1. Szabo V., Ventalon C., De Sars V., Bradley J., Emiliani V. Spatially selective holographic photoactivation and functional fluorescence imaging in freely behaving mice with a fiberscope. Neuron. 2014;84:1157–1169. doi: 10.1016/j.neuron.2014.11.005. - DOI - PubMed

MeSH terms

LinkOut - more resources