. 2022 Sep 16;23(18):10837.
doi: 10.3390/ijms231810837.

Cerium Oxide Nanoparticles Regulate Oxidative Stress in HeLa Cells by Increasing the Aquaporin-Mediated Hydrogen Peroxide Permeability

Affiliations

Cerium Oxide Nanoparticles Regulate Oxidative Stress in HeLa Cells by Increasing the Aquaporin-Mediated Hydrogen Peroxide Permeability

Giorgia Pellavio et al. Int J Mol Sci. .

Abstract

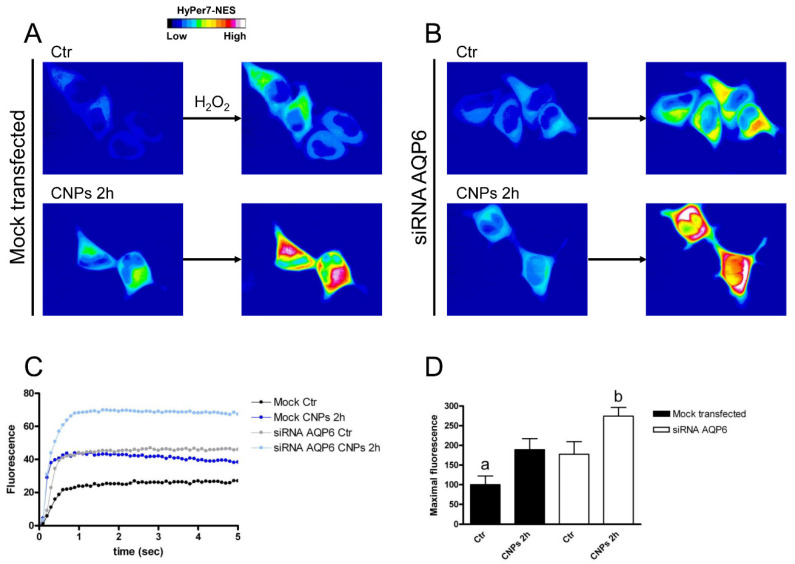
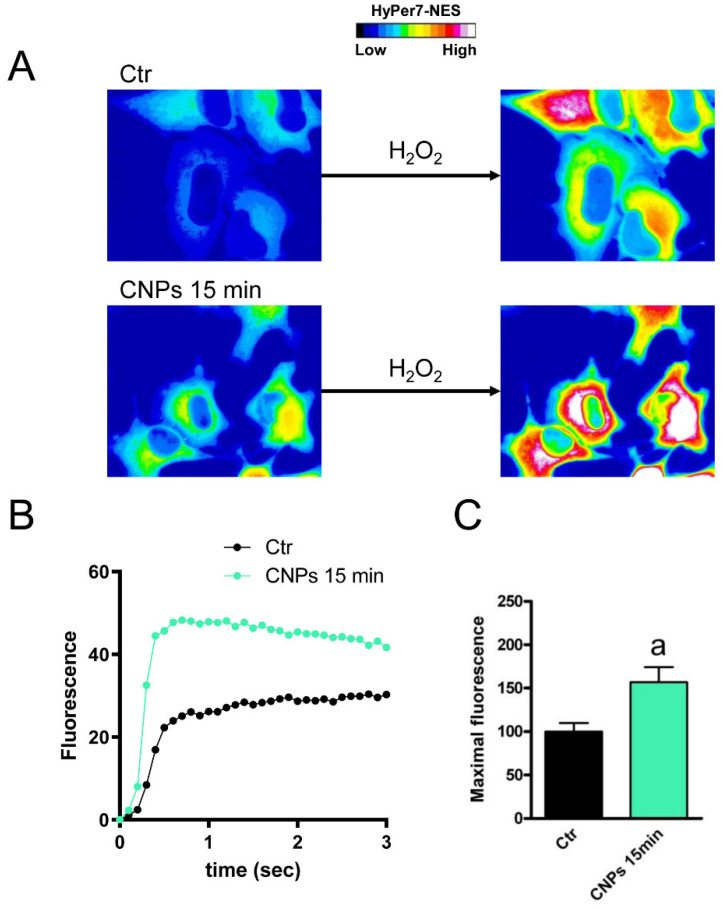
Some aquaporins (AQPs) allow the diffusion of hydrogen peroxide (H2O2), the most abundant ROS, through the cell membranes. Therefore, the possibility of regulating the AQP-mediated permeability to H2O2, and thus ROS scavenging, appears particularly important for controlling the redox state of cells in physiological and pathophysiological conditions. Several compounds have been screened and characterized for this purpose. This study aimed to analyze the effect of cerium oxide nanoparticles (CNPs) presenting antioxidant activity on AQP functioning. HeLa cells express AQP3, 6, 8, and 11, able to facilitate H2O2. AQP3, 6, and 8 are expressed in the plasma membrane and intracellularly, while AQP11 resides only in intracellular structures. CNPs but not cerium ions treatment significantly increased the water and H2O2 permeability by interacting with AQP3, 6, and especially with AQP8. CNPs increased considerably the AQP-mediated water diffusion in cells with oxidative stress. Functional experiments with silenced HeLa cells revealed that CNPs increased the H2O2 diffusion mainly by modulating the AQP8 permeability but also the AQP3 and AQP6, even if to a lesser extent. Current findings suggest that CNPs represent a promising pharmaceutical agent that might potentially be used in numerous pathologies involving oxidative stress as tumors and neurodegenerative diseases.

Keywords: CeO2; HeLa; HyPer7 probe; nanoparticles; peroxiporin; water channels.


Conflict of interest statement

The authors declare no conflict of interest.

Figures

Figure 1
Figure 1
Aquaporins mRNA expression in HeLa cells. Transcripts of all AQPs were found except AQP2 and AQP10. Bars represent the mean  ±  SEM of ΔCt values (n  =  4). a, p  <  0.05 versus AQP1, AQP4, AQP5, AQP7, AQP8, AQP11; b, p  <  0.05 versus AQP6, AQP9; c, p < 0.05 versus AQP8, AQP11.
Figure 2
Figure 2
Expression of AQP3, AQP6, AQP8, and AQP11 proteins in HeLa cells. Blots representative of three were shown. Each lane was loaded with 30 μg of proteins and probed with affinity-purified antibodies as described in the Materials and Methods. The same blots were stripped and reprobed with an anti-β-2-microglobulin (β2M) antibody, as housekeeping. Major bands of the expected molecular weights are shown.
Figure 3
Figure 3
Representative images of confocal laser scanning microscopy of AQP3, AQP6, AQP8, and AQP11 with CNPs in HeLa cells. Green labeling indicates the presence of AQPs (A), red labeling the CNPs (B), and DAPI (blue; C) counterstained nuclei. Yellow labeling shows the colocalization signal of AQP with CNPs (D). Scale bar, 10 μm.
Figure 4
Figure 4
Three-dimensional colocalization analysis of AQP3, AQP6, AQP8, and AQP11 with CNPs in HeLa cells. Statistical analysis of Pearson’s correlation coefficient r (A), Van Steensel’s maxima cross-correlation function (CCFmax) (B), and Manders’ colocalization coefficients (M1 and M2) (C,D) were obtained from 4 different double immunofluorescence experiments with anti-AQP antibodies and red-labeled CNPs (see Materials and Methods). Coefficients were determined by 3D analysis of at least 20 cells for each cell line (8–15 z-stack for image) using the JACoP plugin of Fiji. The columns represent the mean ± SEM of the coefficient values (Brown–Forsythe and Welch ANOVA tests followed by Dunnett T3 post-test). a, p < 0.05 versus AQP6, AQP11; b, p < 0.05 versus AQP3, AQP6, AQP8; c, p < 0.05 versus AQP6, AQP8, AQP11; d, p < 0.05 versus AQP8, AQP11.
Figure 5
Figure 5
Effect of cerium formulated in nanoparticles (CNPs; A) and cerium nonformulated in CNPs (Ce; Β) on the water permeability of HeLa cells. Cells were treated for 15 min or 2 h with CNPs and Ce in the presence or in the absence of a post-treatment with β-mercaptoethanol (BME). Cells were then exposed to a 150 mOsm osmotic gradient. Bars represent the osmotic water permeability of HeLa cells expressed as a percent of k relative. Ctr, controls. Values are means ± SEM of 4–15 single shots for each of 4 different experiments (ANOVA, followed by Newman–Keuls’s Q test). (A) a, p < 0.05 versus CNPs 15 min, CNPs 15 min + ΒME, CNPs 2 h, CNPs 2 h + ΒME; b, p < 0.05 versus CNPs 15 min, CNPs 15 min + ΒME, CNPs 2 h + ΒME. (B) a, p < 0.05 versus Ctr, Ce 15 min + ΒME, Ce 2 h + ΒME; b, p < 0.05 versus Ctr.
Figure 6
Figure 6
Effect of CNPs on the water permeability of HeLa cells in normal and in oxidative stress conditions. The osmotic water permeability was studied in HeLa cells treated with CNPs (green bars) or in untreated cells (white bars) in three different conditions: (1) unstressed cells (control; Ctr); (2) heat-stressed cells (heat; endogenous oxidative stress); (3) cells treated with H2O2 (H2O2; exogenous oxidative stress). Bars represent the osmotic water permeability of HeLa cells expressed as a percent of k relative. Values are means ± SEM of 4–15 single shots for each of 4 different experiments (ANOVA, followed by Newman–Keuls’s Q test). a, p < 0.05 versus H2O2, Heat; b, p < 0.05 versus CNPs treated cells; c, p < 0.05 versus Ctr.
Figure 7
Figure 7
Hydrogen peroxide transport in HeLa cells with AQP3 reduced expression in the presence and in the absence of CNPs treatment. (A) Representative frames extracted from videos showing the kinetics of H2O2 transport into mock-transfected HeLa cells before (left panel) and after (right panel) addition of 50 μM H2O2 in the absence (Ctr) and in the presence of CNPs treatment (CNPs). The increased HyPer7-NES fluorescence is shown in pseudocolor (upper panel, the scale used is indicated in the insert). (B) Representative frames extracted from videos showing the kinetics of H2O2 transport into AQP3-silenced (siRNA AQP3) HeLa cells before (left panel) and after (right panel) addition of 50 μM H2O2 in the absence (Ctr) and in the presence of CNPs treatment (CNPs). The increased HyPer7-NES fluorescence is shown in pseudocolor (upper panel, the scale used is indicated in the insert). (C) Time course of H2O2 fluorescence into mock- and siRNA-transfected HeLa cells, in the absence (Ctr) and in the presence of CNPs treatment (CNPs). Curves start when 50 μM H2O2 was added. Results are the mean of at least 3 different experiments and SEMs were omitted for clarity. (D) Maximal H2O2 fluorescence values were obtained by computerized least squares regression, fitting the experimental points of the time courses of H2O2 transported curves with a one-phase exponential association equation (GraphPad Prism 4.00, 2003). a, p < 0.05 versus CNPs 2 h mock-transfected, control AQP3-null; b, p < 0.05 versus CNPs 2 h AQP3-null; c, p < 0.05 versus control AQP3-null, CNPs 2 h AQP3-null (ANOVA for repeated measures followed by Newman–Keuls’s Q test).
Figure 8
Figure 8
Hydrogen peroxide transport in HeLa cells with AQP6 reduced expression in the presence and in the absence of CNPs treatment. (A) Representative frames extracted from videos showing the kinetics of H2O2 transport into mock-transfected HeLa cells before (left panel) and after (right panel) addition of 50 μM H2O2 in the absence (Ctr) and in the presence of CNPs treatment (CNPs). The increased HyPer7-NES fluorescence is shown in pseudocolor (upper panel, the scale used is indicated in the insert). (B) Representative frames extracted from videos showing the kinetics of H2O2 transport into AQP6-silenced (siRNA AQP6) HeLa cells before (left panel) and after (right panel) addition of 50 μM H2O2 in the absence (Ctr) and in the presence of CNPs treatment (CNPs). The increased HyPer7-NES fluorescence is shown in pseudocolor (upper panel, the scale used is indicated in the insert). (C) Time course of H2O2 fluorescence into mock- and siRNA-transfected HeLa cells, in the absence (Ctr) and in the presence of CNPs treatment (CNPs). Curves start when 50 μM H2O2 was added. Results are the mean of at least 3 different experiments and SEMs were omitted for clarity. (D) Maximal H2O2 fluorescence values were obtained by computerized least squares regression, fitting the experimental points of the time courses of H2O2 transported curves with a one-phase exponential association equation (GraphPad Prism 4.00, 2003). a, p < 0.05 versus control AQP6-null, CNPs 2 h mock-transfected, CNPs 2 h AQP6-null; b, p < 0.05 versus control AQP6-null, CNPs 2 h mock-transfected (ANOVA for repeated measures followed by Newman–Keuls’s Q test).
Figure 9
Figure 9
Hydrogen peroxide transport in HeLa cells with AQP8 reduced expression in the presence and in the absence of CNPs treatment. (A) Representative frames extracted from videos showing the kinetics of H2O2 transport into mock-transfected HeLa cells before (left panel) and after (right panel) addition of 50 μM H2O2 in the absence (Ctr) and in the presence of CNPs treatment (CNPs). The increased HyPer7-NES fluorescence is shown in pseudocolor (upper panel, the scale used is indicated in the insert). (B) Representative frames extracted from videos showing the kinetics of H2O2 transport into AQP8-silenced (siRNA AQP8) HeLa cells before (left panel) and after (right panel) addition of 50 μM H2O2 in the absence (Ctr) and in the presence of CNPs treatment (CNPs). The increased HyPer7-NES fluorescence is shown in pseudocolor (upper panel, the scale used is indicated in the insert). (C) Time course of H2O2 fluorescence into mock- and siRNA-transfected HeLa cells, in the absence (Ctr) and in the presence of CNPs treatment (CNPs). Curves start when 50 μM H2O2 was added. Results are the mean of at least 3 different experiments and SEMs were omitted for clarity. (D) Maximal H2O2 fluorescence values were obtained by computerized least squares regression, fitting the experimental points of the time courses of H2O2 transported curves with a one-phase exponential association equation (GraphPad Prism 4.00, 2003). a, p < 0.05 versus Ctr mock-transfected, Ctr AQP8-null, CNPs 2 h AQP8-null; b, p < 0.05 versus Ctr mock-transfected (ANOVA for repeated measures followed by Newman–Keuls’s Q test).
Figure 10
Figure 10
Hydrogen peroxide transport in HeLa cells with AQP11 reduced expression in the presence and in the absence of CNPs treatment. (A) Representative frames extracted from videos showing the kinetics of H2O2 transport into mock-transfected HeLa cells before (left panel) and after (right panel) addition of 50 μM H2O2 in the absence (Ctr) and in the presence of CNPs treatment (CNPs). The increased HyPer7-NES fluorescence is shown in pseudocolor (upper panel, the scale used is indicated in the insert). (B). Representative frames extracted from videos showing the kinetics of H2O2 transport into AQP11-silenced (siRNA AQP11) HeLa cells before (left panel) and after (right panel) addition of 50 μM H2O2 in the absence (Ctr) and in the presence of CNPs treatment (CNPs). The increased HyPer7-NES fluorescence is shown in pseudocolor (upper panel, the scale used is indicated in the insert). (C) Time course of H2O2 fluorescence into mock- and siRNA-transfected HeLa cells, in the absence (Ctr) and in the presence of CNPs treatment (CNPs). Curves start when 50 μM H2O2 was added. Results are the mean of at least 3 different experiments and SEMs were omitted for clarity. (D) Maximal H2O2 fluorescence values were obtained by computerized least squares regression, fitting the experimental points of the time courses of H2O2 transported curves with a one-phase exponential association equation (GraphPad Prism 4.00, 2003). a, p < 0.05 versus Ctr mock-transfected, CNPs 2 h AQP11-null; b, p < 0.001 versus CNPs 2 h AQP11-null (ANOVA for repeated measures followed by Newman–Keuls’s Q test).
Figure 11
Figure 11
Hydrogen peroxide transport in HeLa cells after a 15 min CNPs treatment. (A) Representative frames extracted from videos showing the kinetics of H2O2 transport into HeLa cells before (left panel) and after (right panel) addition of 50 μM H2O2 in the absence (Ctr) and in the presence of CNPs treatment (CNPs). The increased HyPer7-NES fluorescence is shown in pseudocolor (upper panel, the scale used is indicated in the insert). (B) Time course of H2O2 fluorescence into HeLa cells, in the absence (Ctr) and in the presence of CNPs treatment (CNPs). Curves start when 50 μM H2O2 was added. Results are the mean of at least 3 different experiments and SEMs were omitted for clarity. (C) Maximal H2O2 fluorescence values were obtained by computerized least squares regression, fitting the experimental points of the time courses of H2O2 transported curves with a one-phase exponential association equation (GraphPad Prism 4.00, 2003). a, p < 0.05 versus control (Ctr) (Student’s t-test).

Similar articles

Cited by

References

    1. King L.S., Kozono D., Agre P. From structure to disease: The evolving tale of aquaporin biology. Nat. Rev. Mol. Cell Biol. 2004;5:687–698. doi: 10.1038/nrm1469. - DOI - PubMed
    1. Benga G. The first discovered water channel protein, later called aquaporin 1: Molecular characteristics, functions and medical implications. Mol. Aspects Med. 2012;33:518–534. doi: 10.1016/j.mam.2012.06.001. - DOI - PubMed
    1. Verkman A.S. More than just water channels: Unexpected cellular roles of aquaporins. J Cell Sci. 2005;118:3225–3232. doi: 10.1242/jcs.02519. - DOI - PubMed
    1. Laforenza U., Bottino C., Gastaldi G. Mammalian aquaglyceroporin function in metabolism. Biochim. Biophys. Acta. 2016;1858:1–11. doi: 10.1016/j.bbamem.2015.10.004. - DOI - PubMed
    1. Saadoun S., Papadopoulos M.C., Hara-Chikuma M., Verkman A.S. Impairment of angiogenesis and cell migration by targeted aquaporin-1 gene disruption. Nature. 2005;434:786–792. doi: 10.1038/nature03460. - DOI - PubMed

LinkOut - more resources