

Identification of AGR2 Gene-Specific Expression Patterns Associated with Epithelial-Mesenchymal Transition
- PMID: 36142758
- PMCID: PMC9504245
- DOI: 10.3390/ijms231810845
Identification of AGR2 Gene-Specific Expression Patterns Associated with Epithelial-Mesenchymal Transition
Abstract
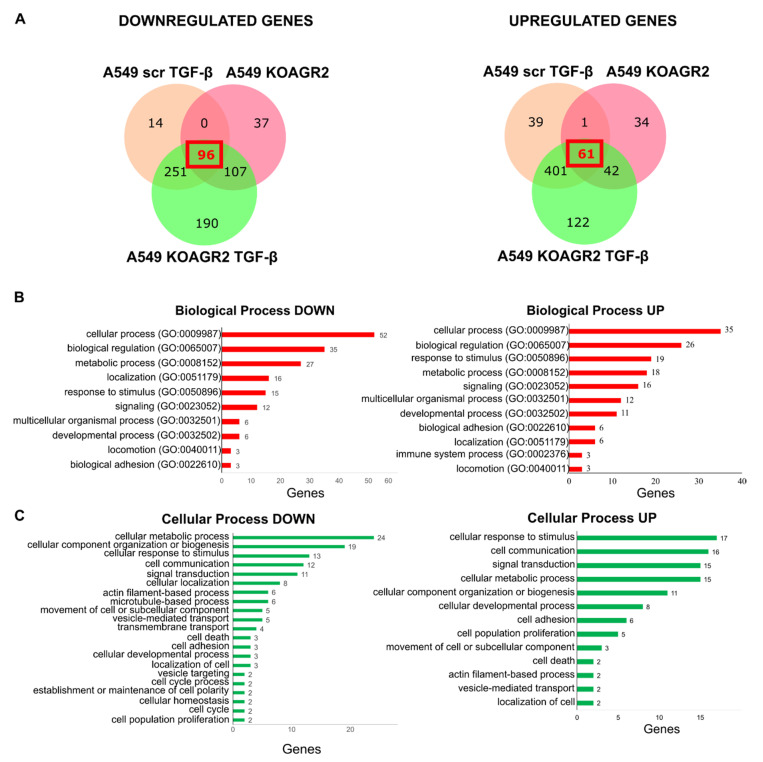
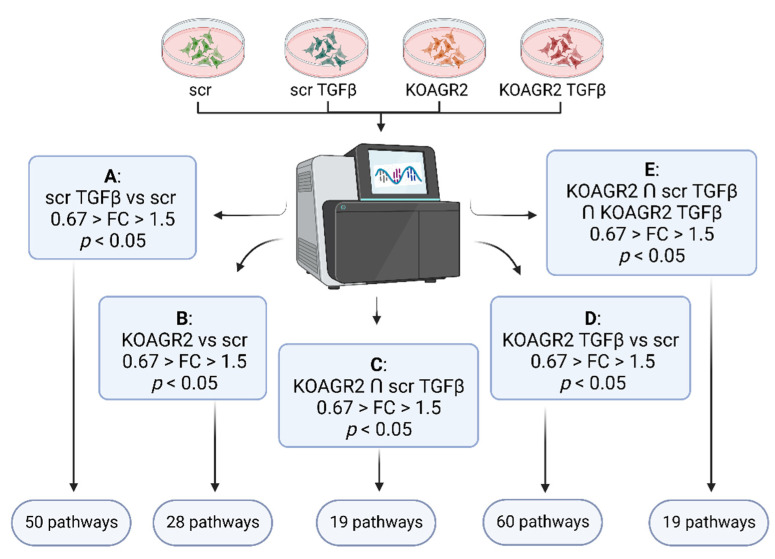
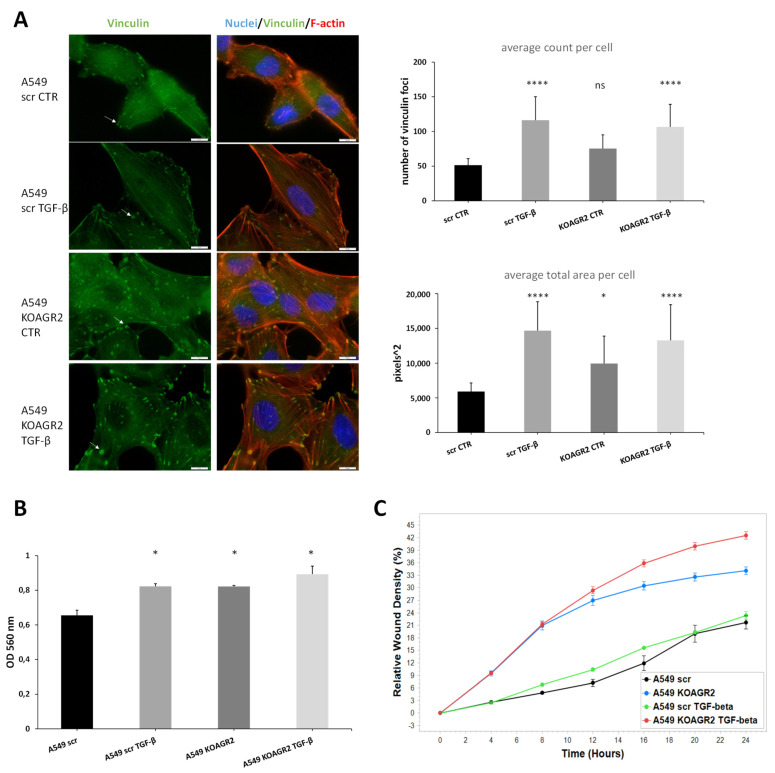
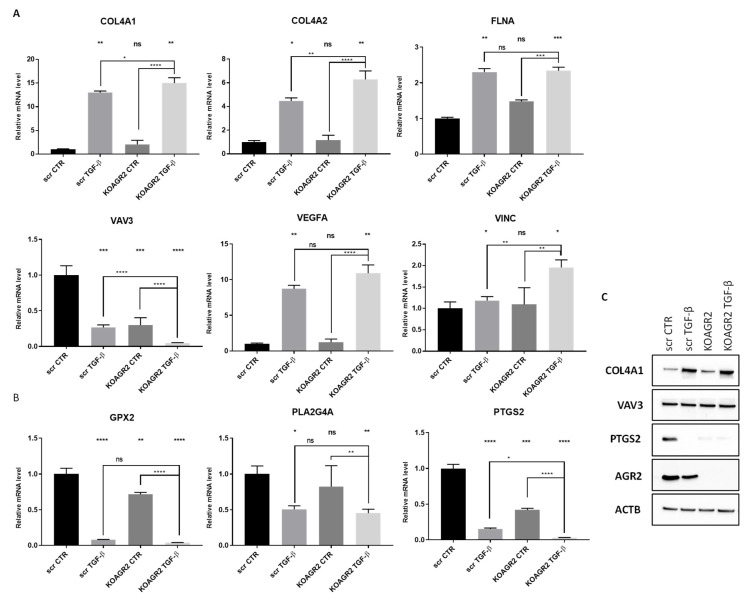
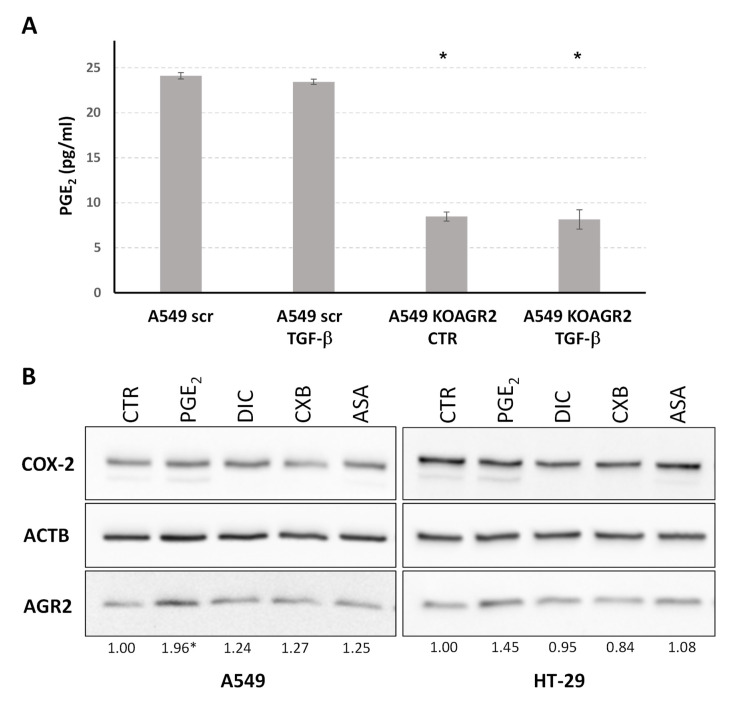
The TGF-β signaling pathway is involved in numerous cellular processes, and its deregulation may result in cancer development. One of the key processes in tumor progression and metastasis is epithelial to mesenchymal transition (EMT), in which TGF-β signaling plays important roles. Recently, AGR2 was identified as a crucial component of the cellular machinery responsible for maintaining the epithelial phenotype, thereby interfering with the induction of mesenchymal phenotype cells by TGF-β effects in cancer. Here, we performed transcriptomic profiling of A549 lung cancer cells with CRISPR-Cas9 mediated AGR2 knockout with and without TGF-β treatment. We identified significant changes in transcripts associated with focal adhesion and eicosanoid production, in particular arachidonic acid metabolism. Changes in transcripts associated with the focal adhesion pathway were validated by RT-qPCR of COL4A1, COL4A2, FLNA, VAV3, VEGFA, and VINC mRNAs. In addition, immunofluorescence showed the formation of stress fibers and vinculin foci in cells without AGR2 and in response to TGF-β treatment, with synergistic effects observed. These findings imply that both AGR2 downregulation and TGF-β have a role in focal adhesion formation and cancer cell migration and invasion. Transcripts associated with arachidonic acid metabolism were downregulated after both AGR2 knockout and TGF-β treatment and were validated by RT-qPCR of GPX2, PTGS2, and PLA2G4A. Since PGE2 is a product of arachidonic acid metabolism, its lowered concentration in media from AGR2-knockout cells was confirmed by ELISA. Together, our results demonstrate that AGR2 downregulation and TGF-β have an essential role in focal adhesion formation; moreover, we have identified AGR2 as an important component of the arachidonic acid metabolic pathway.
Keywords: AGR2; EMT; RNAseq; TGF-β; arachidonic acid; focal adhesion.
Conflict of interest statement
The authors declare no conflict of interest.
Figures
Similar articles
-
Suppression of AGR2 in a TGF-β-induced Smad regulatory pathway mediates epithelial-mesenchymal transition.BMC Cancer. 2017 Aug 15;17(1):546. doi: 10.1186/s12885-017-3537-5. BMC Cancer. 2017. PMID: 28810836 Free PMC article.
-
Anterior gradient 2 downregulation in a subset of pancreatic ductal adenocarcinoma is a prognostic factor indicative of epithelial-mesenchymal transition.Lab Invest. 2015 Feb;95(2):193-206. doi: 10.1038/labinvest.2014.138. Epub 2014 Nov 24. Lab Invest. 2015. PMID: 25418581
-
ESE1/AGR2 axis antagonizes TGF-β-induced epithelial-mesenchymal transition in low-grade pancreatic cancer.Cancer Med. 2023 Mar;12(5):5979-5993. doi: 10.1002/cam4.5397. Epub 2022 Nov 3. Cancer Med. 2023. PMID: 36329620 Free PMC article.
-
[Aberrant Activation Mechanism of TGF-β Signaling in Epithelial-mesenchymal Transition].Yakugaku Zasshi. 2021;141(11):1229-1234. doi: 10.1248/yakushi.21-00143. Yakugaku Zasshi. 2021. PMID: 34719542 Review. Japanese.
-
Crosstalk between TGF-β signaling and miRNAs in breast cancer metastasis.Tumour Biol. 2016 Aug;37(8):10011-9. doi: 10.1007/s13277-016-5060-8. Epub 2016 May 6. Tumour Biol. 2016. PMID: 27153853 Review.
Cited by
-
Unveiling histotype-specific biomarkers in ovarian carcinoma using proteomics.Mol Ther Oncol. 2025 Jul 16;33(3):201019. doi: 10.1016/j.omton.2025.201019. eCollection 2025 Sep 18. Mol Ther Oncol. 2025. PMID: 40778374 Free PMC article.
-
AGR2: The Covert Driver and New Dawn of Hepatobiliary and Pancreatic Cancer Treatment.Biomolecules. 2024 Jun 23;14(7):743. doi: 10.3390/biom14070743. Biomolecules. 2024. PMID: 39062458 Free PMC article. Review.
-
A prenatal skin atlas reveals immune regulation of human skin morphogenesis.Nature. 2024 Nov;635(8039):679-689. doi: 10.1038/s41586-024-08002-x. Epub 2024 Oct 16. Nature. 2024. PMID: 39415002 Free PMC article.
-
Elevated Expression of Cell Adhesion, Metabolic, and Mucus Secretion Gene Clusters Associated with Tumorigenesis, Metastasis, and Poor Survival in Pancreatic Ductal Adenocarcinoma.Cancers (Basel). 2024 Dec 3;16(23):4049. doi: 10.3390/cancers16234049. Cancers (Basel). 2024. PMID: 39682235 Free PMC article.
-
Short-term immune-checkpoint inhibition partially rescues perturbed bone marrow hematopoiesis in mismatch-repair deficient tumors.Oncoimmunology. 2023 Jun 28;12(1):2230669. doi: 10.1080/2162402X.2023.2230669. eCollection 2023. Oncoimmunology. 2023. PMID: 37396958 Free PMC article.
References
-
- Brabletz T., Jung A., Reu S., Porzner M., Hlubek F., Kunz-Schughart L.A., Knuechel R., Kirchner T. Variable beta-catenin expression in colorectal cancers indicates tumor progression driven by the tumor environment. Proc. Natl. Acad. Sci. USA. 2001;98:10356–10361. doi: 10.1073/pnas.171610498. - DOI - PMC - PubMed
MeSH terms
Substances
Grants and funding
LinkOut - more resources
Full Text Sources
Research Materials
Miscellaneous
