

Different Approaches for the Profiling of Cancer Pathway-Related Genes in Glioblastoma Cells
- PMID: 36142793
- PMCID: PMC9504477
- DOI: 10.3390/ijms231810883
Different Approaches for the Profiling of Cancer Pathway-Related Genes in Glioblastoma Cells
Abstract
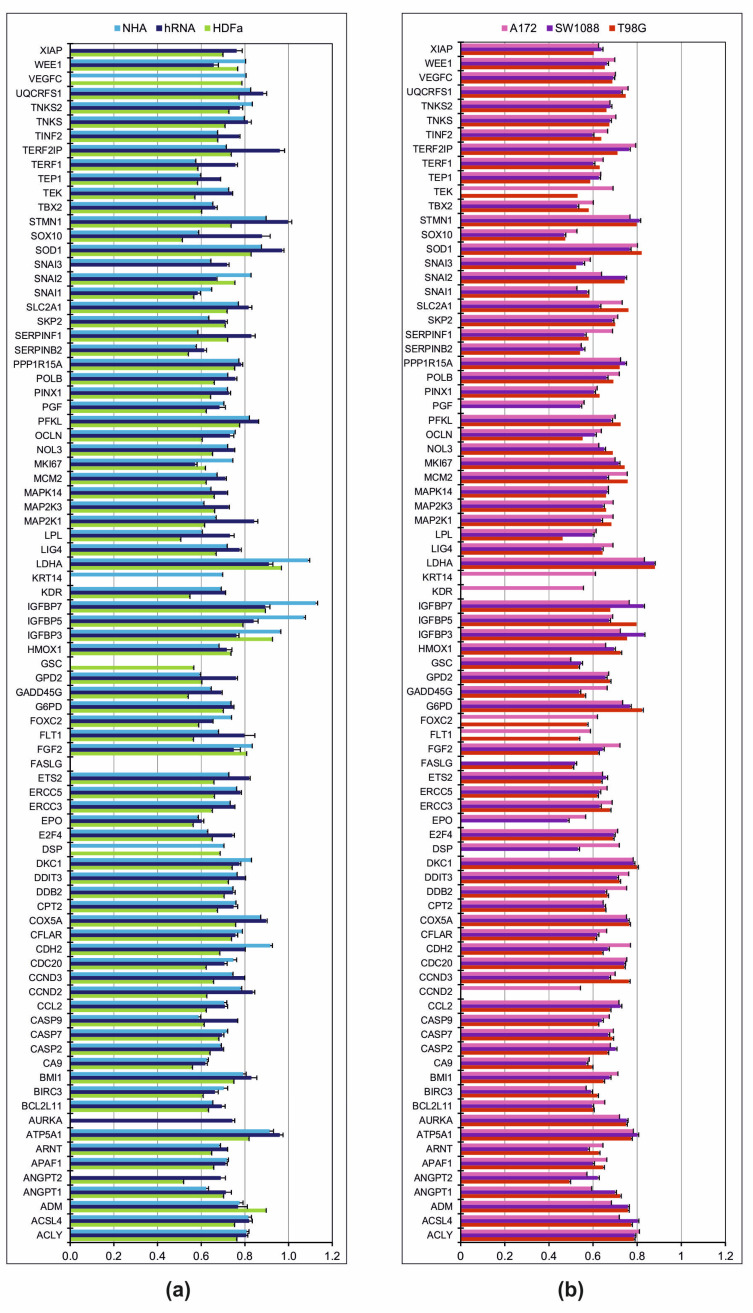
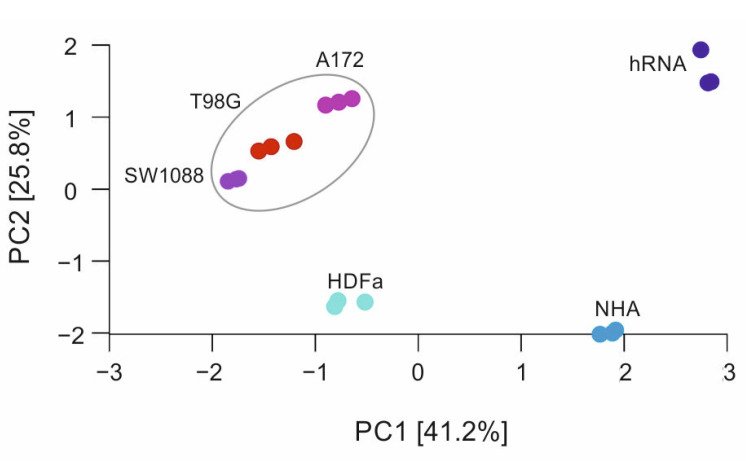
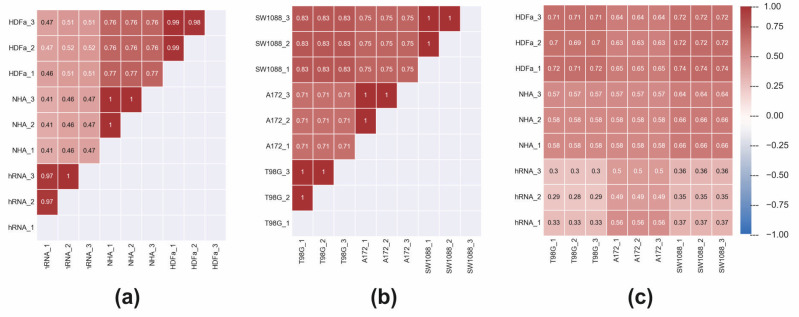
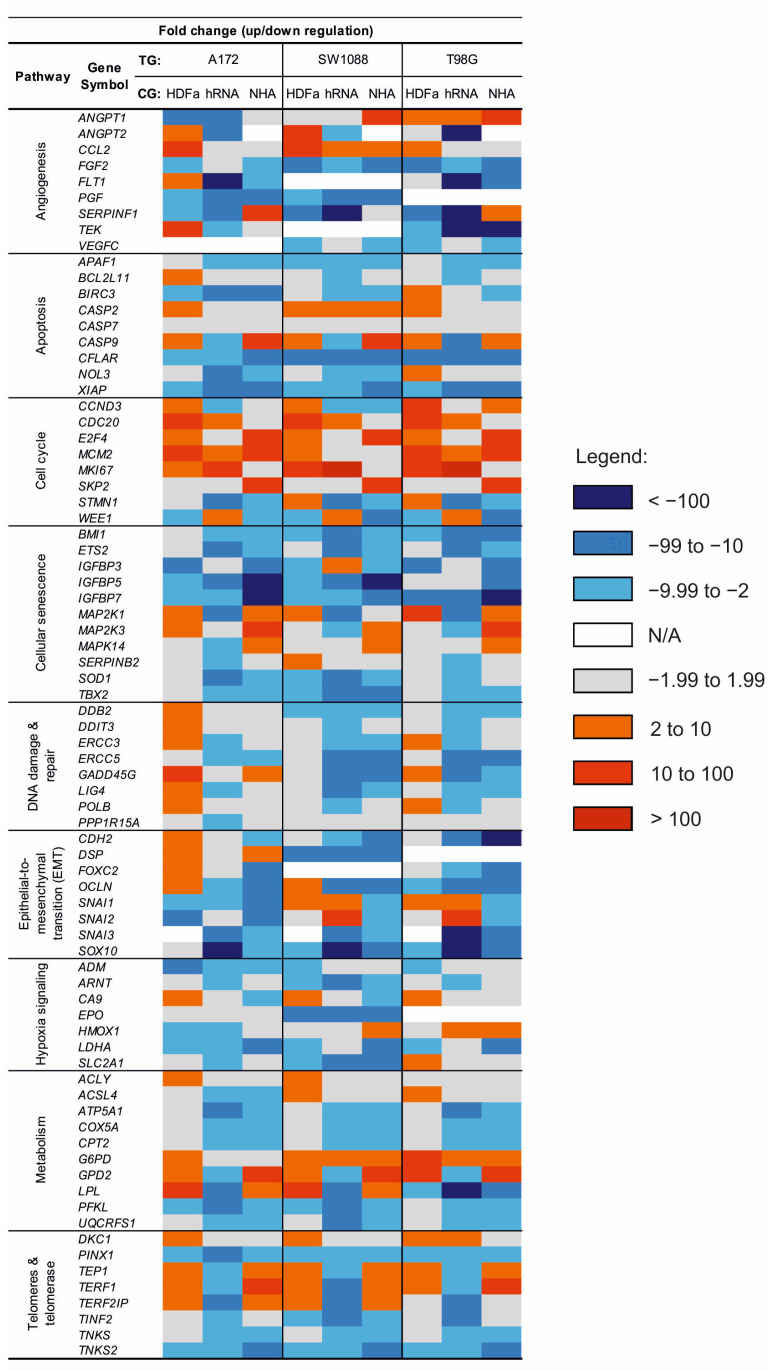
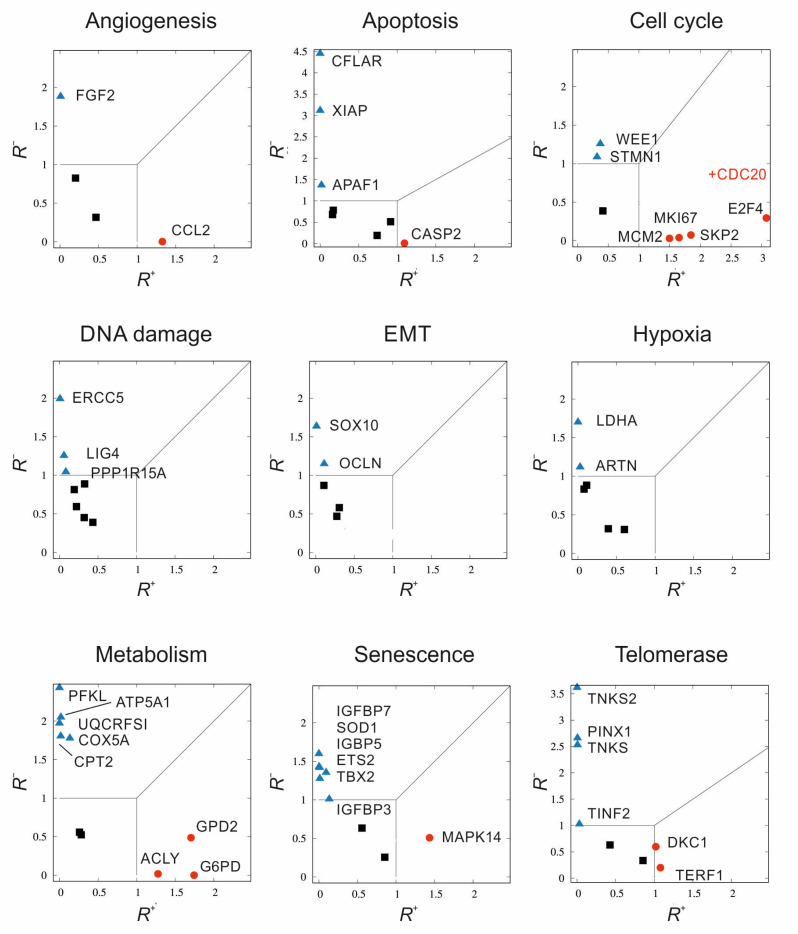
Deregulation of signalling pathways that regulate cell growth, survival, metabolism, and migration can frequently lead to the progression of cancer. Brain tumours are a large group of malignancies characterised by inter- and intratumoral heterogeneity, with glioblastoma (GBM) being the most aggressive and fatal. The present study aimed to characterise the expression of cancer pathway-related genes (n = 84) in glial tumour cell lines (A172, SW1088, and T98G). The transcriptomic data obtained by the qRT-PCR method were compared to different control groups, and the most appropriate control for subsequent interpretation of the obtained results was chosen. We analysed three widely used control groups (non-glioma cells) in glioblastoma research: Human Dermal Fibroblasts (HDFa), Normal Human Astrocytes (NHA), and commercially available mRNAs extracted from healthy human brain tissues (hRNA). The gene expression profiles of individual glioblastoma cell lines may vary due to the selection of a different control group to correlate with. Moreover, we present the original multicriterial decision making (MCDM) for the possible characterization of gene expression profiles. We observed deregulation of 75 genes out of 78 tested in the A172 cell line, while T98G and SW1088 cells exhibited changes in 72 genes. By comparing the delta cycle threshold value of the tumour groups to the mean value of the three controls, only changes in the expression of 26 genes belonging to the following pathways were identified: angiogenesis FGF2; apoptosis APAF1, CFLAR, XIAP; cellular senescence BM1, ETS2, IGFBP5, IGFBP7, SOD1, TBX2; DNA damage and repair ERCC5, PPP1R15A; epithelial to mesenchymal transition SNAI3, SOX10; hypoxia ADM, ARNT, LDHA; metabolism ATP5A1, COX5A, CPT2, PFKL, UQCRFS1; telomeres and telomerase PINX1, TINF2, TNKS, and TNKS2. We identified a human astrocyte cell line and normal human brain tissue as the appropriate control group for an in vitro model, despite the small sample size. A different method of assessing gene expression levels produced the same disparities, highlighting the need for caution when interpreting the accuracy of tumorigenesis markers.
Keywords: cancer pathway; glioblastoma; mRNA; multicriterial analysis.
Conflict of interest statement
The authors declare no conflict of interest.
Figures
Similar articles
-
Quantitative profiling of genes associated with cancer pathways in brain tumors.Klin Onkol. 2023 Spring;36(3):224-233. doi: 10.48095/ccko2023224. Klin Onkol. 2023. PMID: 37353350 English.
-
Overexpression of microRNA-129-5p in glioblastoma inhibits cell proliferation, migration, and colony-forming ability by targeting ZFP36L1.Bosn J Basic Med Sci. 2020 Nov 2;20(4):459-470. doi: 10.17305/bjbms.2019.4503. Bosn J Basic Med Sci. 2020. PMID: 31999936 Free PMC article.
-
Foretinib induces G2/M cell cycle arrest, apoptosis, and invasion in human glioblastoma cells through c-MET inhibition.Cancer Chemother Pharmacol. 2021 Jun;87(6):827-842. doi: 10.1007/s00280-021-04242-0. Epub 2021 Mar 10. Cancer Chemother Pharmacol. 2021. PMID: 33688998
-
Integrative analysis of cell adhesion molecules in glioblastoma identified prostaglandin F2 receptor inhibitor (PTGFRN) as an essential gene.BMC Cancer. 2022 Jun 11;22(1):642. doi: 10.1186/s12885-022-09682-2. BMC Cancer. 2022. PMID: 35690717 Free PMC article. Review.
-
Overview of Transforming Growth Factor β Superfamily Involvement in Glioblastoma Initiation and Progression.Asian Pac J Cancer Prev. 2015;16(16):6813-23. doi: 10.7314/apjcp.2015.16.16.6813. Asian Pac J Cancer Prev. 2015. PMID: 26514451 Review.
Cited by
-
Identification of Lower Grade Glioma Antigens Based on Ferroptosis Status for mRNA Vaccine Development.Pharmgenomics Pers Med. 2024 Apr 11;17:105-123. doi: 10.2147/PGPM.S449230. eCollection 2024. Pharmgenomics Pers Med. 2024. PMID: 38623558 Free PMC article.
-
Mass Spectrometry as a Quantitative Proteomic Analysis Tool for the Search for Temporal Lobe Epilepsy Biomarkers: A Systematic Review.Int J Mol Sci. 2023 Jul 5;24(13):11130. doi: 10.3390/ijms241311130. Int J Mol Sci. 2023. PMID: 37446307 Free PMC article.
-
Relationship between the Expression of Matrix Metalloproteinases and Their Tissue Inhibitors in Patients with Brain Tumors.Int J Mol Sci. 2024 Mar 1;25(5):2858. doi: 10.3390/ijms25052858. Int J Mol Sci. 2024. PMID: 38474106 Free PMC article.
-
IGFBP7+ subpopulation and IGFBP7 risk score in astrocytoma: insights from scRNA-Seq and bulk RNA-Seq.Front Immunol. 2024 Sep 30;15:1434300. doi: 10.3389/fimmu.2024.1434300. eCollection 2024. Front Immunol. 2024. PMID: 39403379 Free PMC article.
-
Senescence-related signatures predict prognosis and response to immunotherapy in colon cancer.J Gastrointest Oncol. 2024 Jun 30;15(3):1020-1034. doi: 10.21037/jgo-24-339. Epub 2024 Jun 27. J Gastrointest Oncol. 2024. PMID: 38989417 Free PMC article.
References
-
- Louis D.N., Perry A., Reifenberger G., von Deimling A., Figarella-Branger D., Cavenee W.K., Ohgaki H., Wiestler O.D., Kleihues P., Ellison D.W. The 2016 World Health Organization Classification of Tumors of the Central Nervous System: A summary. Acta Neuropathol. 2016;131:803–820. doi: 10.1007/s00401-016-1545-1. - DOI - PubMed
-
- Louis D.N., Perry A., Wesseling P., Brat D.J., Cree I.A., Figarella-Branger D., Hawkins C., Ng H.K., Pfister S.M., Reifenberger G., et al. The 2021 WHO Classification of Tumors of the Central Nervous System: A summary. Neuro-Oncology. 2021;23:1231–1251. doi: 10.1093/neuonc/noab106. - DOI - PMC - PubMed
MeSH terms
Substances
Grants and funding
LinkOut - more resources
Full Text Sources
Medical
Miscellaneous
