

Induced Resistance Combined with RNA Interference Attenuates the Counteradaptation of the Western Flower Thrips
- PMID: 36142802
- PMCID: PMC9500759
- DOI: 10.3390/ijms231810886
Induced Resistance Combined with RNA Interference Attenuates the Counteradaptation of the Western Flower Thrips
Abstract
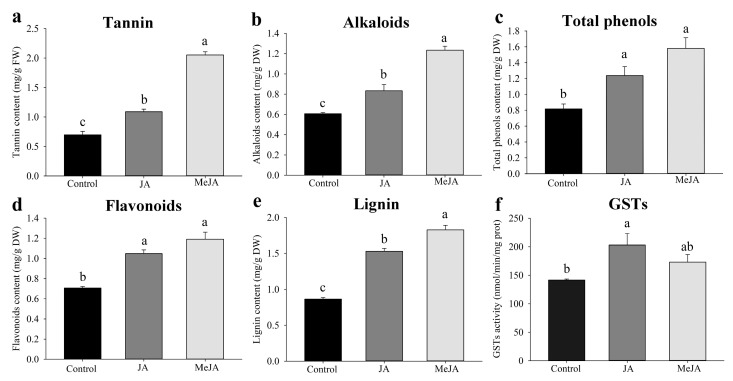
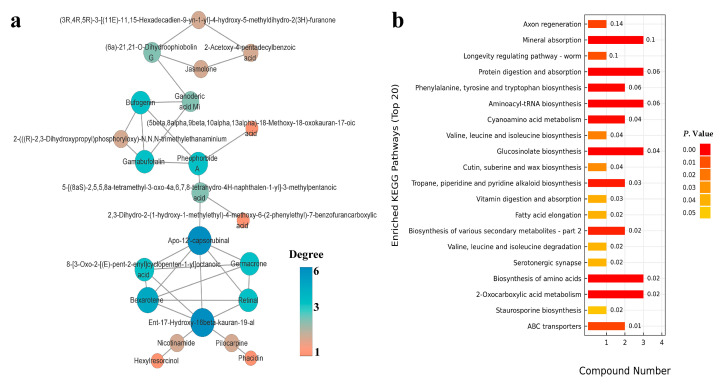
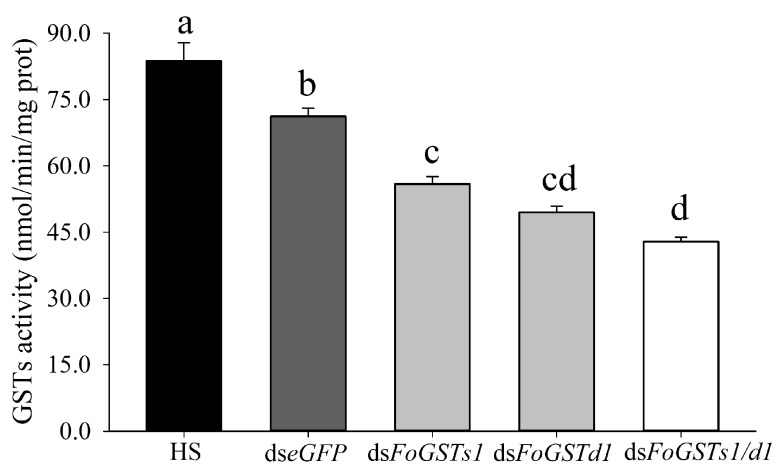
The western flower thrips, Frankliniella occidentalis Pergande, is an invasive pest that damages agricultural and horticultural crops. The induction of plant defenses and RNA interference (RNAi) technology are potent pest control strategies. This study investigated whether the anti-adaptive ability of F. occidentalis to jasmonic acid (JA)- and methyl jasmonate (MeJA)-induced defenses in kidney bean plants was attenuated after glutathione S-transferase (GST) gene knockdown. The expression of four GSTs in thrips fed JA- and MeJA-induced leaves was analyzed, and FoGSTd1 and FoGSTs1 were upregulated. Exogenous JA- and MeJA-induced defenses led to increases in defensive secondary metabolites (tannins, alkaloids, total phenols, flavonoids, and lignin) in leaves. Metabolome analysis indicated that the JA-induced treatment of leaves led to significant upregulation of defensive metabolites. The activity of GSTs increased in second-instar thrips larvae fed JA- and MeJA-induced leaves. Co-silencing with RNAi simultaneously knocked down FoGSTd1 and FoGSTs1 transcripts and GST activity, and the area damaged by second-instar larvae feeding on JA- and MeJA-induced leaves decreased by 62.22% and 55.24%, respectively. The pupation rate of second-instar larvae also decreased by 39.68% and 39.89%, respectively. Thus, RNAi downregulation of FoGSTd1 and FoGSTs1 reduced the anti-adaptive ability of F. occidentalis to JA- or MeJA-induced defenses in kidney bean plants.
Keywords: Frankliniella occidentalis; RNA interference; counteradaptation; glutathione S-transferase; induced defense; jasmonic acid; metabolites; methyl jasmonate.
Conflict of interest statement
The authors declare no conflict of interest.
Figures


Similar articles
-
Induction of Jasmonic Acid-Associated Defenses by Thrips Alters Host Suitability for Conspecifics and Correlates with Increased Trichome Densities in Tomato.Plant Cell Physiol. 2017 Mar 1;58(3):622-634. doi: 10.1093/pcp/pcx014. Plant Cell Physiol. 2017. PMID: 28158865 Free PMC article.
-
Spraying calcium chloride helps to enhance the resistance of kidney bean plants to western flower thrips.Pest Manag Sci. 2025 Jan;81(1):220-229. doi: 10.1002/ps.8424. Epub 2024 Sep 20. Pest Manag Sci. 2025. PMID: 39305065
-
Site-dependent induction of jasmonic acid-associated chemical defenses against western flower thrips in Chrysanthemum.Planta. 2019 Nov 27;251(1):8. doi: 10.1007/s00425-019-03292-2. Planta. 2019. PMID: 31776674
-
Enzymatic activity and development of Frankliniella occidentalis (Thysanoptera: Thripidae) in response to exogenous calcium treatments of kidney bean plants.J Econ Entomol. 2024 Feb 12;117(1):311-322. doi: 10.1093/jee/toad241. J Econ Entomol. 2024. PMID: 38181509
-
Integrated pest management in western flower thrips: past, present and future.Pest Manag Sci. 2017 May;73(5):813-822. doi: 10.1002/ps.4531. Epub 2017 Feb 28. Pest Manag Sci. 2017. PMID: 28127901 Free PMC article. Review.
Cited by
-
Recent Advances in Plant-Insect Interactions.Int J Mol Sci. 2023 Jul 12;24(14):11338. doi: 10.3390/ijms241411338. Int J Mol Sci. 2023. PMID: 37511097 Free PMC article.
-
Biotechnological advancements for sustainable management of thrips.3 Biotech. 2025 Jul;15(7):204. doi: 10.1007/s13205-025-04368-5. Epub 2025 Jun 8. 3 Biotech. 2025. PMID: 40496602 Review.
-
EPG Reveals Dinotefuran's Efficiency in Suppressing the Feeding Behavior of Frankliniella occidentalis on Kidney Bean Leaves.Neotrop Entomol. 2025 Mar 26;54(1):49. doi: 10.1007/s13744-025-01264-8. Neotrop Entomol. 2025. PMID: 40138114
-
Effect of silencing Thrips palmi Btk29A and COL3A1 on fitness and virus acquisition.Front Microbiol. 2023 Oct 19;14:1254246. doi: 10.3389/fmicb.2023.1254246. eCollection 2023. Front Microbiol. 2023. PMID: 37928674 Free PMC article.
-
Resistance of Populus davidiana × P. bolleana overexpressing cinnamoyl-CoA reductase gene to Lymantria dispar larvae.Transgenic Res. 2025 Jan 9;34(1):10. doi: 10.1007/s11248-024-00426-5. Transgenic Res. 2025. PMID: 39786661
References
-
- Kant M.R., Jonckheere W., Knegt B., Lemos F., Liu J., Schimmel B.C., Villarroel C.A., Ataide L.M., Dermauw W., Glas J.J., et al. Mechanisms and ecological consequences of plant defence induction and suppression in herbivore communities. Ann. Bot. 2015;115:1015–1051. doi: 10.1093/aob/mcv054. - DOI - PMC - PubMed
-
- War A.R., Taggar G.K., Hussain B., Taggar M.S., Nair R.M., Sharma H.C. Plant defence against herbivory and insect adaptations. AoB Plants. 2018;10:ply037.
MeSH terms
Substances
Grants and funding
LinkOut - more resources
Full Text Sources
Research Materials
