. 2022 Sep 17;23(18):10890.
doi: 10.3390/ijms231810890.

Evaluation of Sodium Relaxation Times and Concentrations in the Achilles Tendon Using MRI

Affiliations

Evaluation of Sodium Relaxation Times and Concentrations in the Achilles Tendon Using MRI

Benedikt Kamp et al. Int J Mol Sci. .

Abstract

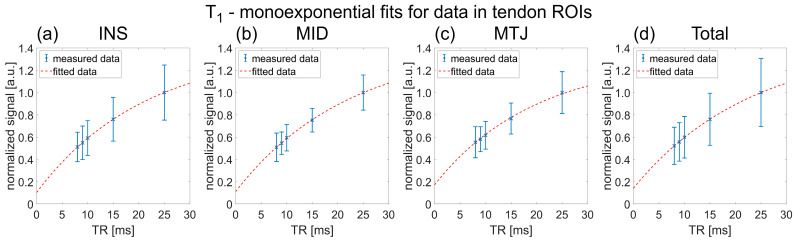
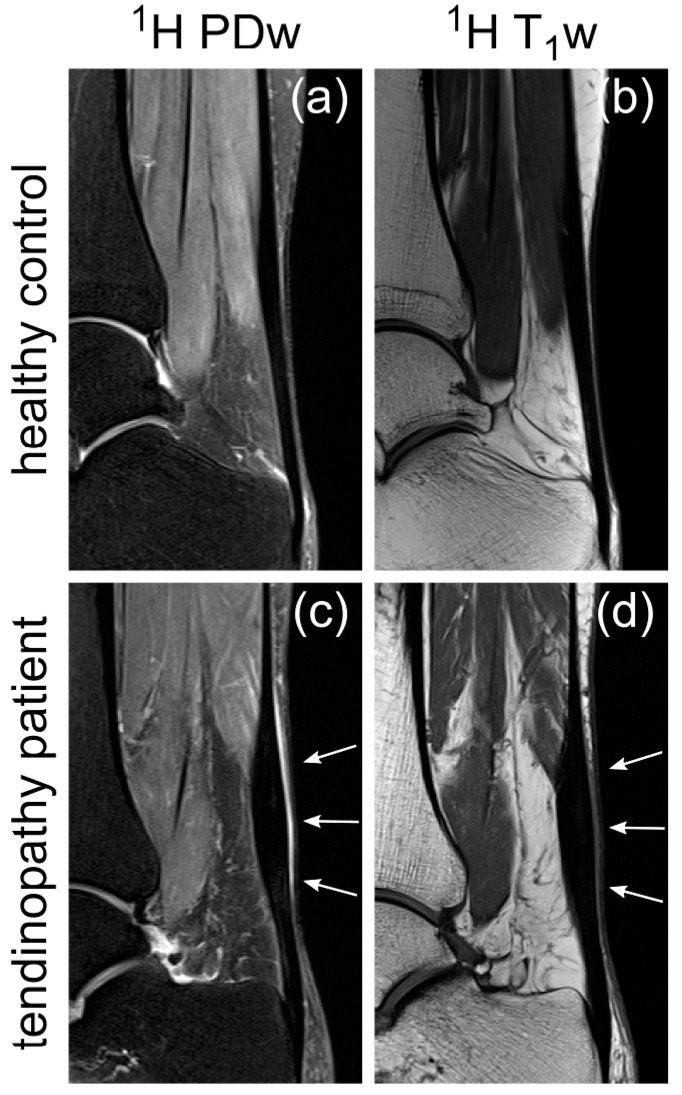
Sodium magnetic resonance imaging (MRI) can be used to evaluate the change in the proteoglycan content in Achilles tendons (ATs) of patients with different AT pathologies by measuring the 23Na signal-to-noise ratio (SNR). As 23Na SNR alone is difficult to compare between different studies, because of the high influence of hardware configurations and sequence settings on the SNR, we further set out to measure the apparent tissue sodium content (aTSC) in the AT as a better comparable parameter. Ten healthy controls and one patient with tendinopathy in the AT were examined using a clinical 3 Tesla (T) MRI scanner in conjunction with a dual tuned 1H/23Na surface coil to measure 23Na SNR and aTSC in their ATs. 23Na T1 and T2* of the AT were also measured for three controls to correct for different relaxation behavior. The results were as follows: 23Na SNR = 11.7 ± 2.2, aTSC = 82.2 ± 13.9 mM, 23Na T1 = 20.4 ± 2.4 ms, 23Na T2s* = 1.4 ± 0.4 ms, and 23Na T2l* = 13.9 ± 0.8 ms for the whole AT of healthy controls with significant regional differences. These are the first reported aTSCs and 23Na relaxation times for the AT using sodium MRI and may serve for future comparability in different studies regarding examinations of diseased ATs with sodium MRI.

Keywords: 23Na MRI; Achilles tendon; collagen; glycosaminoglycan; proteoglycan; sodium MRI; sodium concentration; sodium relaxation time; tendon.


Conflict of interest statement

The authors declare no conflict of interest.

Figures

Figure 1
Figure 1
Data points and fitting results of 23Na T1 relaxation times in the different Achilles tendon (AT) regions of interest (ROIs) of an exemplary healthy control. ROIs were named after their position, where (a) corresponded to the most distal 3 cm of the AT, i.e., the distal 3 cm of the tendon’s length extending into the calcaneal insertion (INS), (b) corresponded to the middle 3 cm, i.e., the middle portion of the AT (MID), and (c) corresponded to the proximal 3 cm, which was referred to as the myotendinous junction (MTJ). In (d), the data and fitting of the total ROI combining all three ROIs, i.e., INS, MID and MTJ are displayed. The corresponding parameter results were (a) 23Na T1 = 21.2 ms, R2 = 0.999, (b) 23Na T1 = 22.1 ms, R2 = 0.999, (c) 23Na T1 = 19.6 ms, R2 = 0.997 and (d) 23Na T1 = 23.1 ms, R2 = 0.999.
Figure 2
Figure 2
Data points and fitting results to determine 23Na T2* relaxation times in the different AT ROIs of an exemplary healthy control. The corresponding parameter results were (a) 23Na T2s* = 1.0 ms, 23Na T2l* = 13.3 ms, ps = 32.7%, R2 = 0.997, (b) 23Na T2s* = 1.2 ms, 23Na T2l* = 13.6 ms, ps = 34.9%, R2 = 0.998, (c) 23Na T2s* = 1.4 ms, 23Na T2l* = 13.8 ms, ps = 35.7%, R2 = 0.994 and (d) 23Na T2s* = 1.1 ms, 23Na T2l* = 13.3 ms, ps = 33.2%, R2 = 0.998.
Figure 3
Figure 3
Apparent tissue sodium concentration (aTSC) (a,d) and 23Na signal-to-noise ratio (SNR) (b,e) as well as 1H T2* maps (c,f) overlaid onto the 1H images acquired with the density-adapted radial sequence using TE = 9 ms. The overlaid colormaps are displayed for an exemplary healthy control (ac) and the patient with Achilles tendinopathy (df). The different AT ROIs (INS, MID and MTJ) are outlined and labelled according to their position.
Figure 4
Figure 4
Sagittal proton density (PD) (a,c) and T1 (b,d) weighted images of an exemplary healthy control (a,b) and the patient with Achilles tendinopathy (c,d) acquired as anatomical reference in line with clinical standard procedures. The patient showed local thickening mainly in the middle part of the AT with adjacent peritendinous fluid in the same region, which is both highlighted in (c,d) with white arrows.
Figure 5
Figure 5
Boxplots illustrating the results for healthy controls for (a) aTSC, (b) 23Na SNR and (c) 1H T2* for the AT ROIs INS, MID, MTJ and the total ROI, which is the combination of the previous three. The parentheses above the boxplots indicate whether the difference between the groups was significant (*) in the Bonferroni corrected Wilcoxon rank-sum tests with a significance level of p ≤ 0.05.

Similar articles

Cited by

References

    1. Komi P.V. Relevance of In Vivo Force Measurements to Human Biomechanics. J. Biomech. 1990;23((Suppl. S1)):23–34. doi: 10.1016/0021-9290(90)90038-5. - DOI - PubMed
    1. Dederer K.M., Tennant J.N. Anatomical and Functional Considerations in Achilles Tendon Lesions. Foot Ankle Clin. 2019;24:371–385. doi: 10.1016/j.fcl.2019.04.001. - DOI - PubMed
    1. Juras V., Apprich S., Pressl C., Zbyn S., Szomolanyi P., Domayer S., Hofstaetter J.G., Trattnig S. Histological Correlation of 7 T Multi-Parametric MRI Performed in Ex-Vivo Achilles Tendon. Eur. J. Radiol. 2013;82:740–744. doi: 10.1016/j.ejrad.2011.09.022. - DOI - PubMed
    1. Del Buono A., Chan O., Maffulli N. Achilles Tendon: Functional Anatomy and Novel Emerging Models of Imaging Classification. Int. Orthop. 2013;37:715–721. doi: 10.1007/s00264-012-1743-y. - DOI - PMC - PubMed
    1. Ahmed I.M., Lagopoulos M., McConnell P., Soames R.W., Sefton G.K. Blood Supply of the Achilles Tendon. J. Orthop. Res. 1998;16:591–596. doi: 10.1002/jor.1100160511. - DOI - PubMed