

Gene Expression and DNA Methylation in Human Papillomavirus Positive and Negative Head and Neck Squamous Cell Carcinomas
- PMID: 36142875
- PMCID: PMC9504918
- DOI: 10.3390/ijms231810967
Gene Expression and DNA Methylation in Human Papillomavirus Positive and Negative Head and Neck Squamous Cell Carcinomas
Abstract
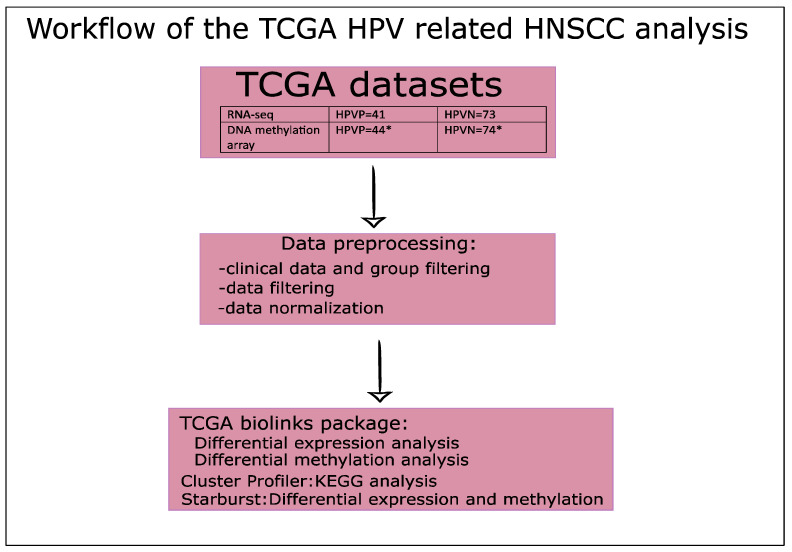
High-risk human papillomaviruses (HPV) are important agents, responsible for a large percentage of the 745,000 cases of head and neck squamous cell carcinomas (HNSCC), which were identified worldwide in 2020. In addition to being virally induced, tobacco and heavy alcohol consumption are believed to cause DNA damage contributing to the high number of HNSCC cases. Gene expression and DNA methylation differ between HNSCC based on HPV status. We used publicly available gene expression and DNA methylation profiles from the Cancer Genome Atlas and compared HPV positive and HPV negative HNSCC groups. We used differential gene expression analysis, differential methylation analysis, and a combination of these two analyses to identify the differences. Differential expression analysis identified 1854 differentially expressed genes, including PCNA, TNFRSF14, TRAF1, TRAF2, BCL2, and BIRC3. SYCP2 was identified as one of the top deregulated genes in the differential methylation analysis and in the combined differential expression and methylation analyses. Additionally, pathway and ontology analyses identified the extracellular matrix and receptor interaction pathway as the most altered between HPV negative and HPV positive HNSCC groups. Combining gene expression and DNA methylation can help in elucidating the genes involved in HPV positive HNSCC tumorigenesis, such as SYCP2 and TAF7L.
Keywords: HPV; cancer; gene expression; head and neck cancer; methylation.
Conflict of interest statement
The authors declare no conflict of interest.
Figures


Similar articles
-
Characterization of Epigenomic Alterations in HPV16+ Head and Neck Squamous Cell Carcinomas.Cancer Epidemiol Biomarkers Prev. 2022 Apr 1;31(4):858-869. doi: 10.1158/1055-9965.EPI-21-0922. Cancer Epidemiol Biomarkers Prev. 2022. PMID: 35064062 Free PMC article.
-
Preferential activation of the hedgehog pathway by epigenetic modulations in HPV negative HNSCC identified with meta-pathway analysis.PLoS One. 2013 Nov 4;8(11):e78127. doi: 10.1371/journal.pone.0078127. eCollection 2013. PLoS One. 2013. PMID: 24223768 Free PMC article.
-
Human papillomavirus and head and neck squamous cell carcinoma in a UK population: Is there an association?Indian J Cancer. 2022 Jan-Mar;59(1):65-72. doi: 10.4103/ijc.IJC_599_19. Indian J Cancer. 2022. PMID: 33753602
-
High Risk-Human Papillomavirus in HNSCC: Present and Future Challenges for Epigenetic Therapies.Int J Mol Sci. 2022 Mar 23;23(7):3483. doi: 10.3390/ijms23073483. Int J Mol Sci. 2022. PMID: 35408843 Free PMC article. Review.
-
The radiobiology of HPV-positive and HPV-negative head and neck squamous cell carcinoma.Expert Rev Mol Med. 2020 Jul 2;22:e3. doi: 10.1017/erm.2020.4. Expert Rev Mol Med. 2020. PMID: 32611474 Free PMC article. Review.
Cited by
-
Role of DNA Methylation Profiles as Potential Biomarkers and Novel Therapeutic Targets in Head and Neck Cancer.Cancers (Basel). 2023 Sep 22;15(19):4685. doi: 10.3390/cancers15194685. Cancers (Basel). 2023. PMID: 37835379 Free PMC article. Review.
-
Association of Gene Expression Profiles in HPV-Positive Head and Neck Squamous Cell Carcinoma with Patient Outcome: In Search of Prognostic Biomarkers.Int J Mol Sci. 2025 Jun 19;26(12):5894. doi: 10.3390/ijms26125894. Int J Mol Sci. 2025. PMID: 40565370 Free PMC article.
-
Global DNA Methylation Level in Tumour and Margin Samples in Relation to Human Papilloma Virus and Epstein-Barr Virus in Patients with Oropharyngeal and Oral Squamous Cell Carcinomas.Biomedicines. 2024 Apr 20;12(4):914. doi: 10.3390/biomedicines12040914. Biomedicines. 2024. PMID: 38672268 Free PMC article.
-
Nicotine-induced CHRNA5 activation modulates CES1 expression, impacting head and neck squamous cell carcinoma recurrence and metastasis via MEK/ERK pathway.Cell Death Dis. 2024 Oct 29;15(10):785. doi: 10.1038/s41419-024-07178-4. Cell Death Dis. 2024. PMID: 39472448 Free PMC article.
-
Implications of oral dysbiosis and HPV infection in head and neck cancer: from molecular and cellular mechanisms to early diagnosis and therapy.Front Oncol. 2023 Dec 18;13:1273516. doi: 10.3389/fonc.2023.1273516. eCollection 2023. Front Oncol. 2023. PMID: 38179168 Free PMC article. Review.
References
-
- Global Cancer Observatory. [(accessed on 30 August 2022)]. Available online: https://gco.iarc.fr/
-
- Worldwide Cancer Data|World Cancer Research Fund International. [(accessed on 30 August 2022)]. Available online: https://www.wcrf.org/cancer-trends/worldwide-cancer-data/
MeSH terms
Substances
LinkOut - more resources
Full Text Sources
Medical
Research Materials
Miscellaneous
