. 2022 Sep 15;11(18):5412.
doi: 10.3390/jcm11185412.

Individual Trajectories of Bone Mineral Density Reveal Persistent Bone Loss in Bone Sarcoma Patients: A Retrospective Study

Affiliations

Individual Trajectories of Bone Mineral Density Reveal Persistent Bone Loss in Bone Sarcoma Patients: A Retrospective Study

Sofia Avnet et al. J Clin Med. .

Abstract

Multiagent chemotherapy offers an undoubted therapeutic benefit to cancer patients, but is also associated with chronic complications in survivors. Osteoporosis affects the quality of life of oncologic patients, especially at the paediatric age. However, very few studies have described the extent of loss of bone mineral density (BMD) in bone sarcoma patients. We analysed a retrospective series of children and adolescents with primary malignant bone tumours (52 osteosarcoma and 31 Ewing sarcoma) and retrieved their BMD at diagnosis and follow-up as Hounsfield units (HU). We studied their individual BMD trajectories before and after chemotherapy up to 5 years, using routine chest CT scan and attenuation thresholds on T12 vertebrae ROI. At one year, bone sarcoma patients showed significant bone loss compared to diagnosis: 17.6% and 17.1% less for OS and EW, respectively. Furthermore, a bone loss of more than 49.2 HU at one-year follow-up was predictive of the persistence of a reduced bone mass over the following 4 years, especially in patients with EW. At 4 years, only 26% and 12.5% of OS and EW, respectively, had recovered or improved their BMD with respect to the onset, suggesting a risk of developing morbidities related to a low BMD in those subjects.

Keywords: BMD; bone sarcoma; cancer survivors; chemotherapy; computed tomography; osteopenia.


Conflict of interest statement

The authors declare no conflict of interest.

Figures
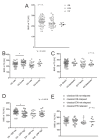
Figure 1
Figure 1
Effect of age, sex, and clinical features on BMD at the onset of patients with bone sarcoma. BMD was measured by ROI attenuation of T12 vertebrae assessed by CT in OS (n = 52), EW (n = 31), and control group (Ctr, n = 6). (A) Values and median of BMD values at the onset; (B) values shown in panel A, divided by sex (Mann–Whitney U test, * p < 0.05); (C) BMD values shown in panel A, divided by the presence/absence of clinically relevant metastases at diagnosis (Mann–Whitney U test); (D) BMD values shown in panel A, divided by low/high CRP values (CRP high > 0.5 mg/100 mL, Mann–Whitney U test, * p < 0.05); (E) BMD values shown in panel A and divided by the presence of relapse at follow-up (Mann–Whitney U test).
Figure 2
Figure 2
Effect of age, sex, and clinical features on BMD at 1 year after treatments of patients with bone sarcoma. In OS (n = 52), EW (n = 31) patients, immediately after completion of treatment protocols (around 1 year after diagnosis, T1), BMD was re-measured with the same method used at T0, by CT assessment. (A) Values and median of BMD at T0 vs. T1 of OS patients (Mann–Whitney U test, **** p < 0.0001); (B) values and median of BMD at T0 vs. T1 of OS patients (Mann–Whitney U test, *** p < 0.001); (C) values of ΔT1–T0 BMD (difference between BMD value at T1 respect to BMD value at T0) shown in panel B, divided by the presence/absence of clinically relevant metastases at diagnosis (Mann–Whitney U test, * p < 0.05); (D) correlation between ΔT1–T0 BMD values shown in panel B and age (OS and EW patients were grouped together, Spearman correlation test, * p < 0.05); (E) correlation between the percentage of BMD loss at T1, compared with the BMD value at T0 of the same patient and age (OS and EW patients were grouped together, Spearman correlation test, ** p < 0.005); (F); ΔT1–T0 BMD values and median shown in panel B, divided by gender (Mann–Whitney U test).
Figure 3
Figure 3
Long-term recovery of BMD: Ewing sarcoma had a worse prognosis. (A) BMD was measured by ROI attenuation level of T12 vertebrae as assessed by CT in OS and EW merged together, at time points T4 and T5 (n = 24, Wilcoxon paired test); (B) box plot of the difference of BMD values of ΔT1–T0 compared with the ΔT4–T0 difference in OS and EW (n = 49 at T0 and 27 at T1 for OS and n = 30 at T0 and 17 at T1 for EW, Mann–Whitney U test, **** p < 0.0001); (C) correlation between the different of BMD values at 4 years from BMD values at diagnosis (ΔT4–T0) and age at the onset (n = 43, Spearman correlation test, * p < 0.05); (D) box plot of ΔT1–T0 BMD values compared to ΔT4–T0 BMD in OS and EW who were less than 16 years old at the onset (n = 49 at T0 and 27 at T1 for OS and n = 30 at T0 and 17 at T1 for EW, Mann–Whitney U test, ** p < 0.001).
Figure 4
Figure 4
BMD trajectory at different follow-ups. (A) BMD was measured by ROI attenuation level of T12 vertebrae as assessed by CT in OS (n = 25), EW (n = 15) at different follow-ups. The trajectory of BDM values over time is expressed as % of decrease in BMD value between T0 and the different time points (Tx) in respect the initial BMD value of the respective patient. We also intended to use the extent of ΔT1–T0 BMD as a predictor inversely related to the ability of patients to restore their bone health. Each individual patient has a specific color. (B) BMD trajectory at different follow-ups by considering only T0, T1, and T4 to highlight the bone recovery or the loss of bone recovery by analysing individual trajectories. We used the 70° percentile of the ΔT1–T0 BMD (<−49.23 HU) as the cut-off, considering all patients with OS and EW (median range −27.83 HU, range −129.00 to 31.4). Red lines correspond to the trajectory of patients with a ΔT1–T0 BMD above the cut-off; (C) ROC curves for OS and EW to evaluate the predictive performance of the ΔT1–T0 BMD values. Recovery of bone health at 4 years after diagnosis in the individual patient was evaluated by using the ΔT4–T0 BMD value as a parameter (* p < 0.01, **** p < 0.0001).

References

    1. Chemaitilly W., Cohen L.E., Mostoufi-Moab S., Patterson B.C., Simmons J.H., Meacham L.R., van Santen H.M., Sklar C.A. Endocrine Late Effects in Childhood Cancer Survivors. J. Clin. Oncol. 2018;36:2153–2159. doi: 10.1200/JCO.2017.76.3268. - DOI - PubMed
    1. Halton J.M., Atkinson S.A., Fraher L., Webber C., Gill G.J., Dawson S., Barr R.D. Altered mineral metabolism and bone mass in children during treatment for acute lymphoblastic leukemia. J. Bone Miner. Res. 1996;11:1774–1783. doi: 10.1002/jbmr.5650111122. - DOI - PubMed
    1. Pfeilschifter J., Diel I.J. Osteoporosis due to cancer treatment: Pathogenesis and management. J. Clin. Oncol. 2000;18:1570–1593. doi: 10.1200/JCO.2000.18.7.1570. - DOI - PubMed
    1. Kang M.J., Lim J.S. Bone mineral density deficits in childhood cancer survivors: Pathophysiology, prevalence, screening, and management. Korean J. Pediatr. 2013;56:60–67. doi: 10.3345/kjp.2013.56.2.60. - DOI - PMC - PubMed
    1. Ritter J., Bielack S.S. Osteosarcoma. Ann. Oncol. 2010;21((Suppl. S7)):vii320–vii325. doi: 10.1093/annonc/mdq276. - DOI - PubMed

LinkOut - more resources