. 2022 Aug 25;12(9):1308.
doi: 10.3390/life12091308.

Characterization of a mGluR5 Knockout Rat Model with Hallmarks of Fragile X Syndrome

Affiliations

Characterization of a mGluR5 Knockout Rat Model with Hallmarks of Fragile X Syndrome

Victoria Dahl et al. Life (Basel). .

Abstract

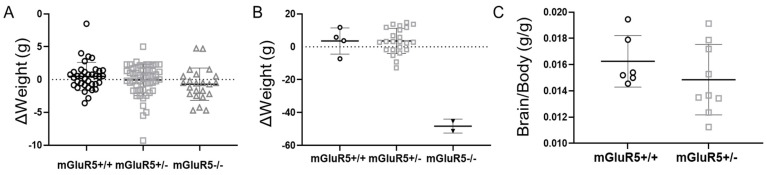
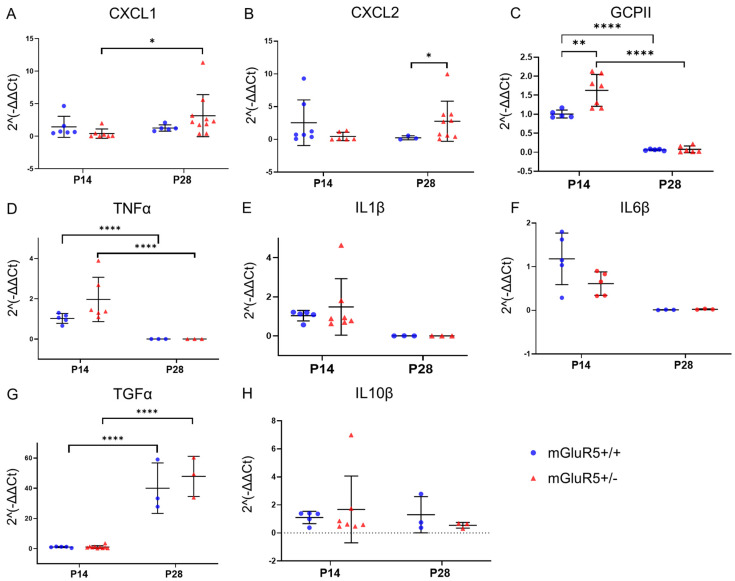
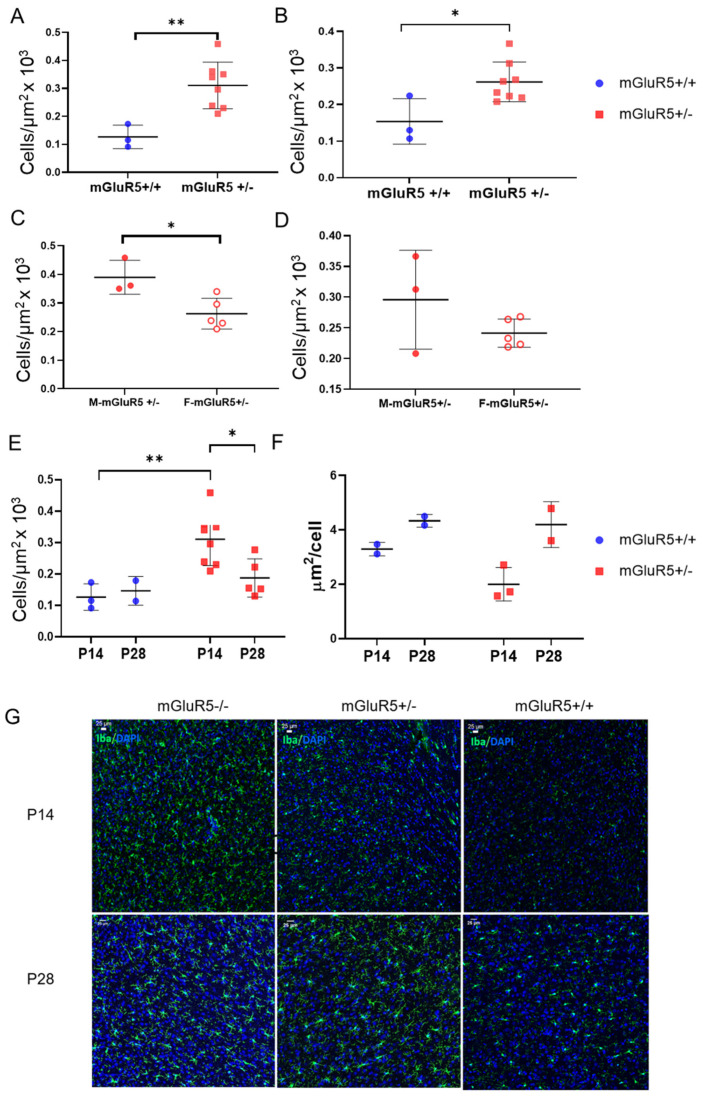
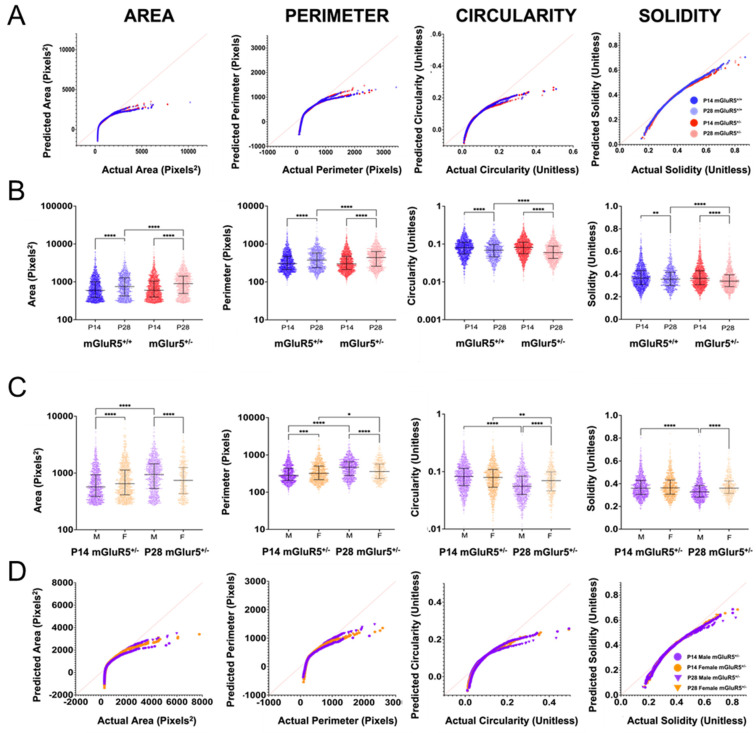
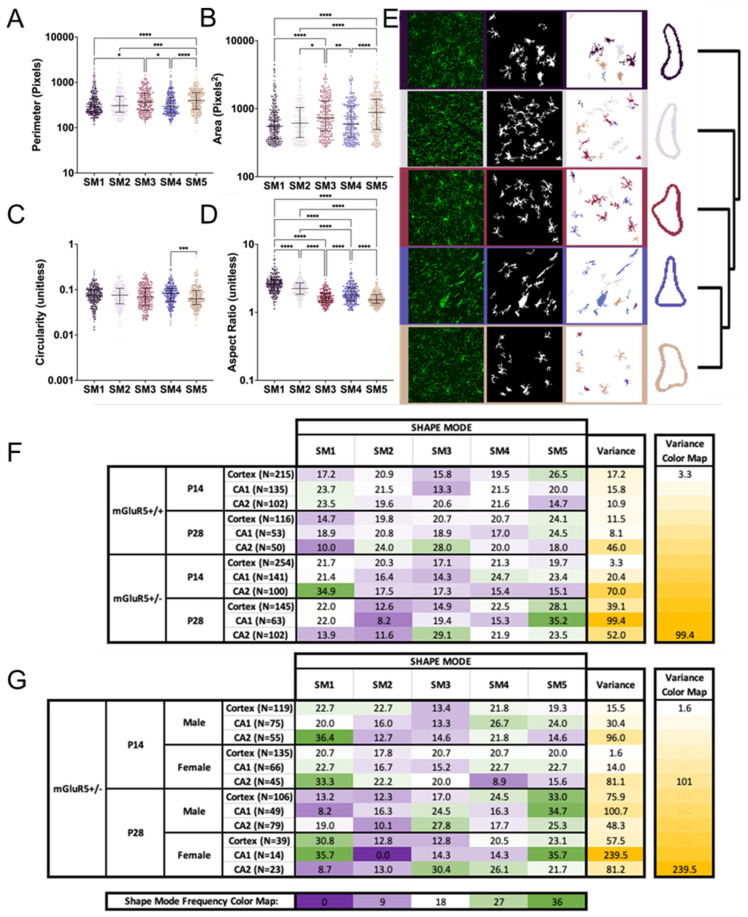
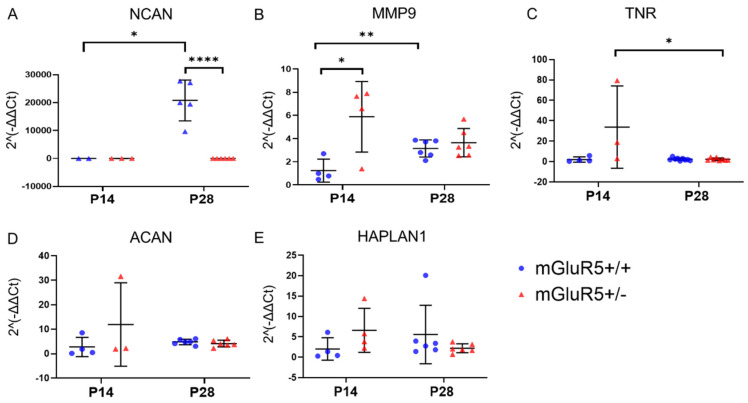
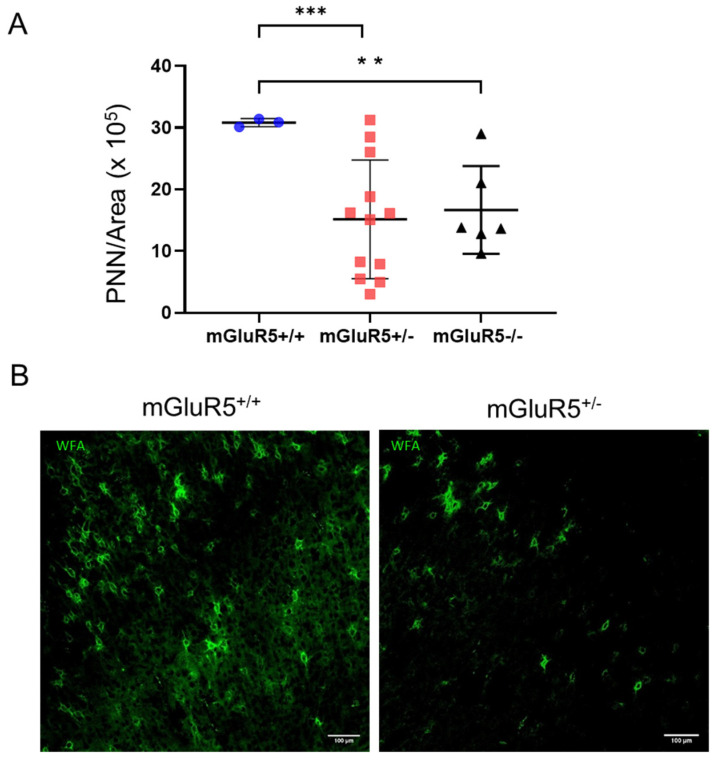
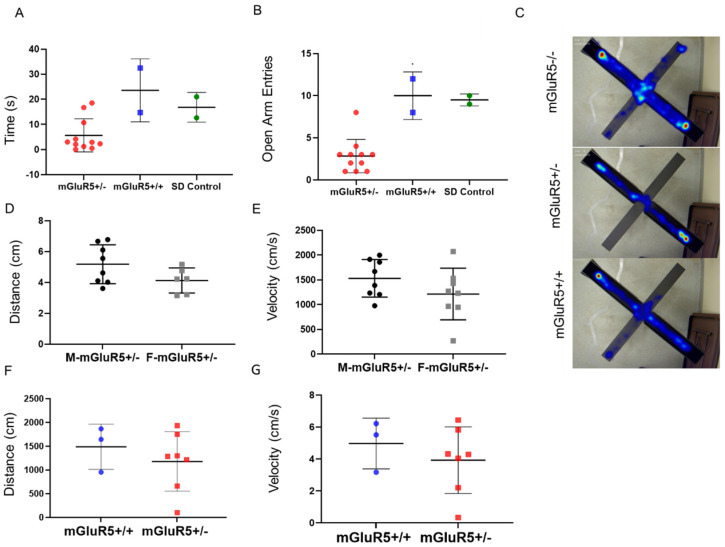
The number of reported cases of neurodevelopmental disorders has increased significantly in the last few decades, but the etiology of these diseases remains poorly understood. There is evidence of a fundamental link between genetic abnormalities and symptoms of autism spectrum disorders (ASDs), and the most common monogenetic inheritable form of ASDs is Fragile X Syndrome (FXS). Previous studies indicate that FXS is linked to glutamate signaling regulation by the G-protein-coupled metabotropic glutamate receptor 5 (mGluR5), which has been shown to have a regulatory role in neuroinflammation. We characterized the effect of knocking out mGluR5 in an organism known to have complex cognitive functions-the rat. The heterozygous phenotype is the most clinically relevant; therefore, we performed analysis in heterozygous pups. We showed developmental abnormalities in heterozygous mGluR5 knockout rats, as well as a significant increase in chemokine (C-X-C motif) ligand 1 (CXCL) expression, a hallmark indicator of early onset inflammation. We quantified an increase in microglial density in the knockout pups and quantified morphological phenotypes representative of greater reactivity in the male vs. female and postnatal day 28 heterozygous pups compared to postnatal day 14 heterozygous pups. In response to injury, reactive microglia release matrix metalloproteases, contribute to extracellular matrix (ECM) breakdown, and are responsible for eradicating cellular and molecular debris. In our study, the changes in microglial density and reactivity correlated with abnormalities in the mRNA expression levels of ECM proteins and with the density of perineuronal nets. We saw atypical neuropsychiatric behavior in open field and elevated plus tests in heterozygous pups compared to wild-type litter and age-matched controls. These results demonstrate the pathological potential of the mGluR5 knockout in rats and further support the presence of neuroinflammatory roots in ASDs.

Keywords: autism spectrum disorders (ASDs); extracellular matrix; machine learning; microglia; neurodevelopmental disorders; neuroinflammation.


Conflict of interest statement

The authors declare no conflict of interest.

Figures

Figure 1
Figure 1
(A) At P14, deviation from average litter-matched body weight for both sexes and mGluR5+/+ (n = 37), mGluR5+/− (n = 57), and mGluR5−/− (n = 23) genotypes. (B) At P28, deviation from average litter-matched body weight for both sexes and mGluR5+/+ (n = 4), mGluR5+/− (n = 23), and mGluR5−/− (n = 2) genotypes. (C) Brain-to-body-weight ratio comparing mGluR5+/− (n = 6) and mGluR5+/+ (n = 9) for sex-aggregated P14 pups. Error bars are the mean ± SD.
Figure 2
Figure 2
Gene expression for both P14 and P28 mGluR5+/+ and mGluR5+/ pups are depicted for: (A) CXCL1 (n = 6 P14 mGluR5+/+, n = 7 P14 mGLuR5+/, n = 5 P28 mGluR5+/+, n = 10 P28 mGluR5+/); (B) CXCL2(n = 6 P14 mGluR5+/+, n = 7 P14 mGLuR5+/, n = 5 P28 mGluR5+/+, n = 10 P28 mGluR5+/); (C) GCPII (n = 5 P14 mGluR5+/+, n = 6 P14 mGLuR5+/, n = 3 P28 mGluR5+/+, n = 3 P28 mGluR5+/); (D) TNFα (n = 5 P14 mGluR5+/+, n = 7 P14 mGLuR5+/, n = 5 P28 mGluR5+/+, n = 6 P28 mGluR5+/); (E) IL1β (n = 5 P14 mGluR5+/+, n = 7 P14 mGLuR5+/, n = 3 P28 mGluR5+/+, n = 3 P28 mGluR5+/-); (F) IL6β (n = 5 P14 mGluR5+/+, n = 5 P14 mGLuR5+/, n = 3 P28 mGluR5+/+, n = 3 P28 mGluR5+/); (G) TGFα (n = 5 P14 mGluR5+/+, n = 7 P14 mGLuR5+/, n = 3 P28 mGluR5+/+, n = 3 P28 mGluR5+/); and (H) IL10β (n = 5 P14 mGluR5+/+, n = 7 P14 mGLuR5+/, n = 3 P28 mGluR5+/+, n = 6 P28 mGluR5+/). All gene expression results are normalized to mGluR5+/+ pups. Blue represents mGluR5+/+ and red represents mGluR5+/.* p < 0.05, ** p < 0.01, and **** p < 0.0001.
Figure 3
Figure 3
(A) P14 cortical microglia density in mGluR5+/+ (n = 3) and mGluR5+/− (n = 8) pups (p = 0.0062). (B) P28 hippocampal microglia density aggregate mGluR5+/+ (n = 3) and mGluR5+/− (n = 8) pups (p = 0.0193). (C) Comparison of microglia density in the cortex for male (n = 3) and female (n = 5) P14 mGluR5+/- pups (p = 0.0206). (D) Comparison of microglia density in the hippocampus for male (n = 3) and female (n = 5) P14 mGluR5+/− pups. (E) Microglia density in the cortex for P14 (n = 3) and P28 (n = 2) mGluR5+/+ and P14 (n = 8) and P28 (n = 5) mGluR5+/− pups (p = 0.0161). (F) Area covered per cell detected for microglia in the cortex for P14 (n = 2) and P28 (n = 2) mGluR5+/+ and P14 (n = 3) and P28 (n = 2) mGluR5+/− pups. (G) Representative images of microglia density in mGluR5+/+, mGluR5+/, and mGluR5/− at P14 and P28. * p < 0.05, ** p < 0.01.
Figure 4
Figure 4
(A) Normal QQ plots of the area, perimeter, circularity, and solidity for the P14 and P28 mGluR5+/+ and mGluR5+/− animals showing the distribution deviation from normality, represented by the red line through the origin. (B) Microglial geometric parameters for the mGluR5+/+ (blue) and mGluR5+/− (red) groups at both P14 (darker intensity) and P28 (lighter intensity): area, perimeter, circularity, and solidity. There were 9 brain slices for P14 mGluR5+/+ and P28 mGluR5+/−; 6 brain slices for P28 mGluR5+/+; 12 brain slices for P14 mGluR5+/−. (C) Microglial geometric parameters for the P14 and P28 animals in both the males and females. There were 6 brain slices for each group except the P28 female mGluR5+/−, which used 3 brain slices. (B,C) Graphs display the median with the interquartile range. ns: not significant, * p < 0.05, ** p < 0.01, *** p < 0.001, and **** p < 0.0001 indicate significant differences with the Kruskal–Wallis test adjusted for multiple comparisons. (D) Normal QQ plots of the area, perimeter, circularity, and solidity for the male and female mGluR5+/− animals showing the distribution deviation from normality, represented by the red line through the origin. The slice counts for each group are as follows: P14 mGlur5+/+ 3 slices, P28 mGlur5+/+ 2 slices, P14 mGlur5+/ 4 slices, 2 male and 2 female, and P28 mGlur5+/ 3 slices, 2 male and 1 female.
Figure 5
Figure 5
Cell shape mode (SM) parameters compared to geometric features for all groups. (AD) Morphology parameters for the five SMs: (A) perimeter, (B) area, (C) circularity, and (D) aspect ratio. The graphs depict the median with the interquartile range. ns: not significant, * p < 0.05, ** p < 0.01, *** p < 0.001, and **** p < 0.0001 indicate significant difference with the Kruskal–Wallis test adjusted for multiple comparisons. (E) Representative images of the segmentation procedure shown with the original cell image, mean threshold images of segmented cells, and color-labeled cells by shape mode for visual representation as represented by the dendrogram on the right. (F) Global heat map of percent SM frequency for both the mGluR5+/+ and mGluR5+/- groups at both P14 and P28 with the calculated variance of each row on the right. The 3-color heat map, green-white-purple, represents 0–18–36%, as shown by the shape mode frequency color map. The 2-color variance heat map, white-yellow, represents 3.3–99.4 variance. The N number represents the total number of cells analyzed in that group. (G) Global heat map of percent SM frequency for the P14 and P28 mGluR5+/- groups in both the males and females. The 3-color heat map, green-white-purple, represents 0–18–36%, as shown by the shape mode frequency color map. The 2-color variance heat map, white-yellow, represents 1.6–239.5 variance. The slice counts for each group are as follows: P14 mGlur5+/+ 3 slices, P28 mGlur5+/+ 2 slices, P14 mGlur5+/- 4 slices, 2 male and 2 female, and P28 mGlur5+/- 3 slices, 2 male and 1 female.
Figure 6
Figure 6
Gene expression for both P14 and P28 mGluR5+/+ and mGluR5+/- pups are depicted for: (A) NCAN (n = 3 P14 mGluR5+/+, n = 3 P14 mGLuR5+/-, n = 5 P28 mGluR5+/+, n = 6 P28 mGluR5+/-); (B) MMP9 (n = 4 P14 mGluR5+/+, n = 4 P14 mGLuR5+/-, n = 6 P28 mGluR5+/+, n = 6 P28 mGluR5+/-); (C) TNR (n = 4 P14 mGluR5+/+, n = 3 P14 mGLuR5+/-, n = 6 P28 mGluR5+/+, n = 6 P28 mGluR5+/-); (D) ACAN (n=4 P14 mGluR5+/+, n = 3 P14 mGLuR5+/-, n = 6 P28 mGluR5+/+, n = 6 P28 mGluR5+/-); and (E) HAPLN1 (n=4 P14 mGluR5+/+, n = 4 P14 mGLuR5+/-, n = 6 P28 mGluR5+/+, n = 6 P28 mGluR5+/-). All gene expression results are normalized to mGluR5+/+ pups. Blue represents mGluR5+/+, and red represents mGluR5+/. * p < 0.05, ** p < 0.01, **** p < 0.0001.
Figure 7
Figure 7
(A) PNN density in the cortex of P28 female mGluR5-/- (n = 6), mGLuR5+/- (n = 12), and mGluR5+/+ (n = 3) pups. (B) The 1000 × 1000 µm representative images of WFA+ PNNs in mGluR5+/+ and mGluR5+/- female pups at P28. Scale bar: 100 µm. ** p < 0.01, *** p < 0.001.
Figure 8
Figure 8
(A) Total time (s) spent in open arms of the elevated plus maze (n = 11 mGluR5+/-, n = 2 mGluR5+/+, n = 2 SD Control). (B) Total number of entries into the open arm (n = 11 mGluR5+/-, n = 2 mGluR5+/+, n = 2 SD Control). (C) Overlaid heat maps of time spent in various zones for mGluR5+/+, mGluR5+/-, and mGluR5-/- pups (n = 11 mGluR5+/-, n = 2 mGluR5+/+, n = 2 mGluR5-/-). (D) Total distance moved in the elevated plus maze of male and female mGluR5+/- pups (n = 8 M, n = 8 F). (E) Average velocity (cm/s) of the pup center point in the elevated plus maze of male and female mGluR5+/- pups (n = 8 M, n = 6 F). (F) Total distance (cm) moved in the open field test (n = 3 mGluR5+/+, n = 7 mGluR5+/-). (G) Average center point velocity (cm/s) in the open field test (n = 3 mGluR5+/+, n = 7 mGluR5+/-).

Similar articles

Cited by

References

    1. ASD Data and Statistics. [(accessed on 21 July 2022)];2021 Available online: https://www.cdc.gov/ncbddd/autism/data/index.html.
    1. Autism and Developmental Disabilities Monitoring Network Surveillance Year 2008 Principal Investigators Prevalence of Autism Spectrum Disorders—Autism and Developmental Disabilities Monitoring Network, 14 Sites, United States, 2008. Surveill. Summ. 2012;61:19. - PubMed
    1. Kado Y., Sanada S., Oono S., Ogino T., Nouno S. Children with autism spectrum disorder comorbid with attention-deficit/hyperactivity disorder examined by the Wisconsin card sorting test: Analysis by age-related differences. Brain Dev. 2020;42:113–120. doi: 10.1016/j.braindev.2019.07.011. - DOI - PubMed
    1. Xu G., Strathearn L., Liu B., Bao W. Prevalence of Autism Spectrum Disorder Among US Children and Adolescents, 2014–2016. JAMA. 2018;319:81–82. doi: 10.1001/jama.2017.17812. - DOI - PMC - PubMed
    1. Buxbaum J.D., Silverman J.M., Smith C.J., Greenberg D.A., Kilifarski M., Reichert J., Cook E.H., Jr., Fang Y., Song C.-Y., Vitale R. Association between a GABRB3 polymorphism and autism. Mol. Psychiatry. 2002;7:311–316. doi: 10.1038/sj.mp.4001011. - DOI - PubMed

LinkOut - more resources