. 2022 Aug 26;12(9):1313.
doi: 10.3390/life12091313.

Temperature Increase and Damage Extent at Retinal Pigment Epithelium Compared between Continuous Wave and Micropulse Laser Application

Affiliations

Temperature Increase and Damage Extent at Retinal Pigment Epithelium Compared between Continuous Wave and Micropulse Laser Application

Yoko Miura et al. Life (Basel). .

Abstract

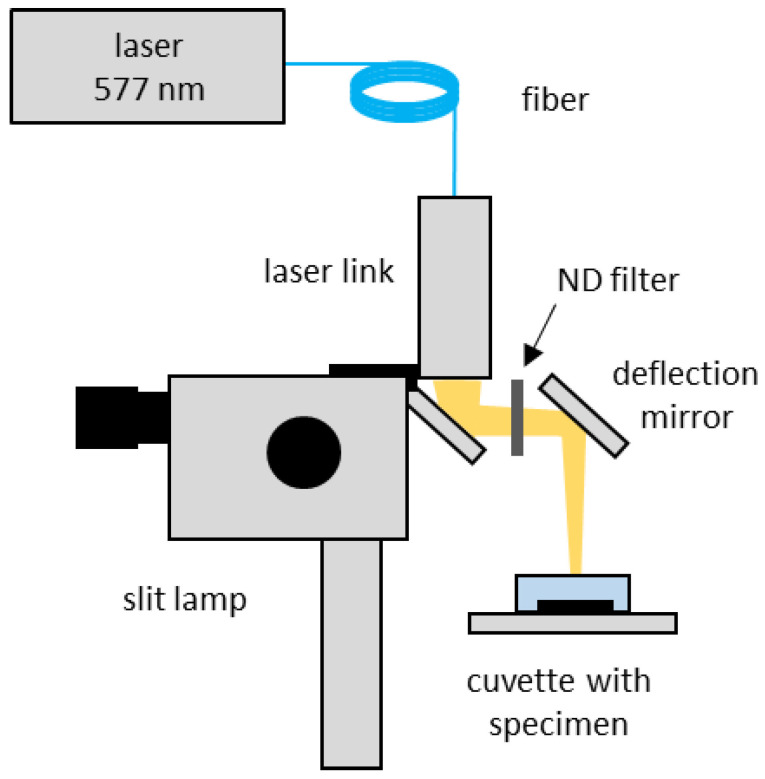
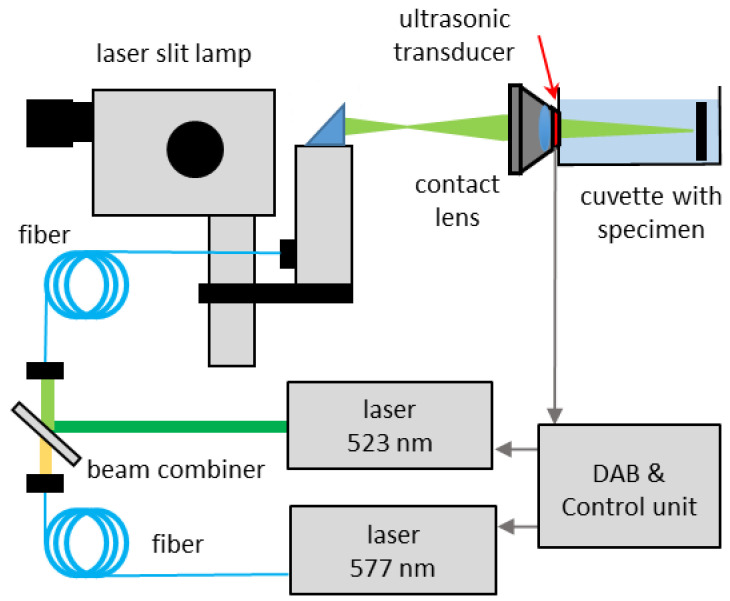
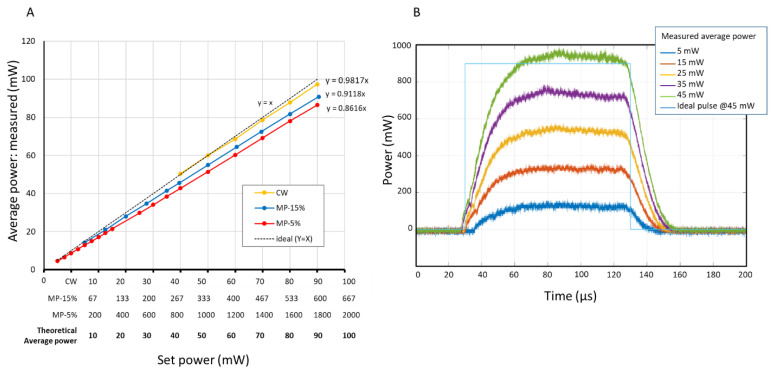
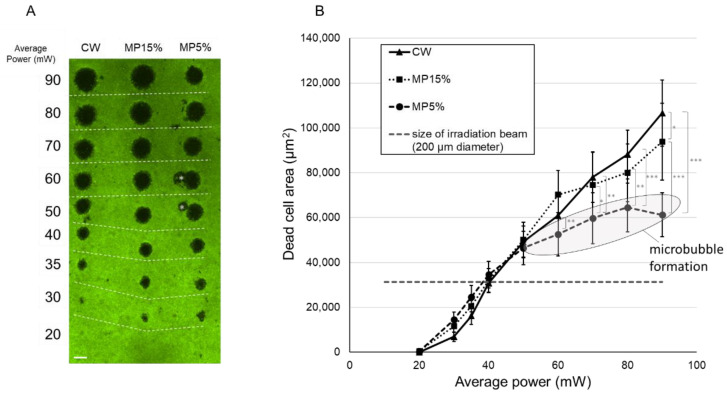
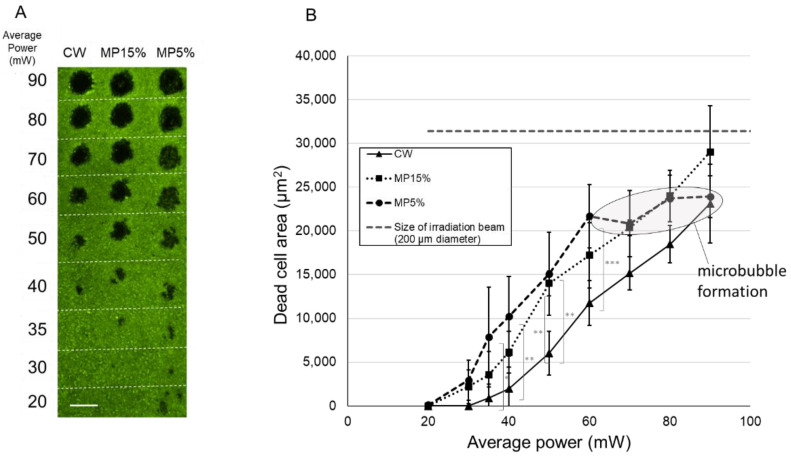
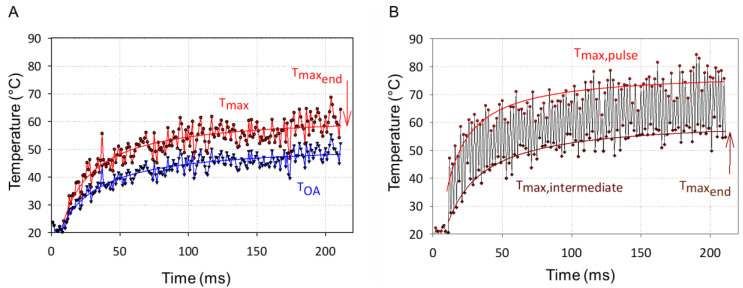
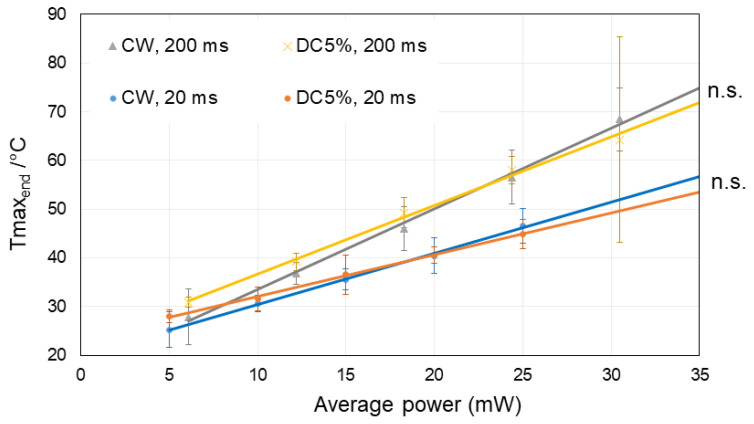
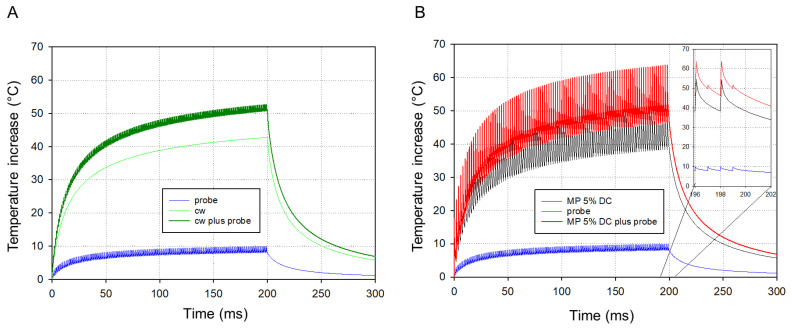
Continuous wave (CW) and microsecond pulse (MP) laser irradiations were compared regarding cell damage and laser-induced temperature rise at retinal pigment epithelium (RPE). The RPE of porcine RPE-choroid-sclera explants was irradiated with a 577 nm laser in CW or MP mode (5% or 15% duty cycle (DC)) for 20 ms or 200 ms at an average laser power of 20−90 mW. Cell viability was investigated with calcein-AM staining. Optoacoustic (OA) technique was employed for temperature measurement during irradiation. For 200 ms irradiation, the dead cell area (DCA) increased linearly (≈1600 µm2/mW) up to the average power of 40 mW for all modes without significant difference. From 50 mW, the increase of DCA of MP-5% significantly dropped to 610 µm2/mW (p < 0.05), likely due to the detected microbubble formation. OA temperature measurement showed a monotonic temperature increase in CW mode and a stepwise increase in MP mode, but no significant difference in the average temperature increase at the same average power, consistent with the temperature modeling. In conclusion, there is no difference in the average temperature rise between CW and MP modes at the same average power regardless of DC. At lower DC, however, more caution is required regarding mechanical damage due to microbubble formation.

Keywords: continuous wave laser; duty cycle; micropulse laser; minimally invasive retinal laser treatment; retinal pigment epithelium; temperature increase.


Conflict of interest statement

The authors declare no conflict of interest.

Figures

Figure 1
Figure 1
Experimental Set-up for RPE damage detection.
Figure 2
Figure 2
Experimental Set-up for optoacoustic temperature measurement. DAB: Data acquisition board.
Figure 3
Figure 3
(A) Plots for the correlation between set laser power and the measured average laser power at the laser link for each mode. (B) Temporal profiles of a single laser pulse in micropulse mode with duty cycle of 5% for different average laser power settings.
Figure 4
Figure 4
RPE cell viability assay after 200 ms irradiation with CW, MP with 15% DC and MP with 5% DC. (A) A representative image from calcein-AM viability assay 1 h after irradiation. Green fluorescence indicates live RPE cells, while non-fluorescence indicates dead or no RPE cells. Asterisk (*) in the image indicates an artifact caused by dead RPE cells at the irradiated site slightly displaced during the staining procedure. Scale bar = 200 µm (B) Dead area size for each setting, measured with the image analysis software FIJI. Mean values are plotted and standard deviations are displayed as error bars. Statistical analysis was conducted by one-way Analysis of Variance (ANOVA) with Tukey’s multiple comparison, using the statistic software GraphPad PRISM (Ver. 7.04). * p < 0.05, ** p < 0.01, *** p < 0.001.
Figure 5
Figure 5
RPE cell viability assay after 20 ms irradiation with CW, MP-15% and MP-5%. (A) A representative image from calcein-AM viability assay 1 h after irradiation. Green fluorescence indicates live RPE cells, while non-fluorescence indicates dead or no RPE cells. Scale bar = 200 µm. (B) The size of dead cell area (DCA) for each mode and power setting, measured with the Image analysis software FIJI. Mean values are plotted and standard deviations are displayed as error bars. Statistical analysis was conducted by one-way Analysis of Variance (ANOVA) with Tukey’s multiple comparison, using the statistic software GraphPad PRISM (Ver. 7.04). * p < 0.05, ** p < 0.01, *** p < 0.001.
Figure 6
Figure 6
Representative pressure transients (OA signals) for absence (A) and presence (B) of microbubble formation, acquired during heating with 40 mW and 50 mW (MP-5% irradiation) respectively. Each transient is displayed in a different color for improved visualization of changes in amplitude and phase. (A) Absence of microbubble formation is indicated by phase stability with slight amplitude rise which accounts for slow and uniform heating. (B) Phase instability and rise in amplitude while pulse energy of probing laser remains constant, indicates microbubble formation.
Figure 7
Figure 7
Representative temperature values for a single laser spot over an irradiation time of 200 ms measured in the CW mode and MP-5% mode with an average power of 25 mW on the same RPE tissue specimen, respectively, including the fitted average temperature rise for: (A) CW mode displaying the mean optoacoustic temperature (lower blue plot) and the maximal temperature (Tmax) course at the central RPE (upper red plot), (B) MP-5% mode showing the maximal temperature at the central RPE at the end of each micropulse (upper red plot: “Tmax, pulse”) and between two micropulses (lower brown plot: “Tmax, intermediate”).
Figure 8
Figure 8
Comparison of the achieved maximal temperatures at the end of the irradiation time (Tmaxend) between CW and MP-5% modes for 200 ms and 20 ms irradiations, respectively, for different average powers including the probe power up to 30 mW. There was no significant difference between CW and MP-5% for the same irradiation time. Mean values are plotted and standard deviations are displayed as error bars. Statistical analysis was conducted by one-way Analysis of Variance (ANOVA) with Tukey’s multiple comparison, using the statistic software GraphPad PRISM (Ver. 7.04). n.s.—not significant.
Figure 9
Figure 9
Simulations of the temperature increase during irradiation: (A) for the CW mode (25 mW) plus probe power (5 mW) and (B) for the MP mode with 5% DC at a peak power of about 500 mW, which leads to the same average laser power of 25 mW, plus probe power (5 mW). The inlay shows a magnification at the end of the irradiation.

Similar articles

Cited by

References

    1. Luttrull J.K., Musch D.C., Mainster M.A. Subthreshold diode micropulse photocoagulation for the treatment of clinically significant diabetic macular oedema. Br. J. Ophthalmol. 2005;89:74–80. doi: 10.1136/bjo.2004.051540. - DOI - PMC - PubMed
    1. Ohkoshi K., Yamaguchi T. Subthreshold micropulse diode laser photocoagulation for diabetic macular edema in Japanese patients. Am. J. Ophthalmol. 2010;149:133–139. doi: 10.1016/j.ajo.2009.08.010. - DOI - PubMed
    1. Lavinsky D., Sramek C., Wang J., Huie P., Dalal R., Mandel Y., Palanker D. Subvisible retinal laser therapy: Titration algorithm and tissue response. Retina. 2014;34:87–97. doi: 10.1097/IAE.0b013e3182993edc. - DOI - PubMed
    1. Berger J.W. Thermal modelling of micropulsed diode laser retinal photocoagulation. Lasers Surg. Med. 1997;20:409–415. doi: 10.1002/(SICI)1096-9101(1997)20:4<409::AID-LSM6>3.0.CO;2-U. - DOI - PubMed
    1. Malik K.J., Sampat K.M., Mansouri A., Steiner J.N., Glaser B.M. Low-intensity/high-density subthreshold microPulse diode laser for chronic central serous chorioretinopathy. Retina. 2015;35:532–536. doi: 10.1097/IAE.0000000000000285. - DOI - PubMed

LinkOut - more resources