. 2022 Aug 26;12(9):1317.
doi: 10.3390/life12091317.

SARS-CoV-2 and HIV: Impact on Pulmonary Epithelial Cells

Affiliations

SARS-CoV-2 and HIV: Impact on Pulmonary Epithelial Cells

Nicholas J Evans et al. Life (Basel). .

Abstract

The SARS-CoV-2 pandemic provides a natural opportunity for the collision of coronavirus disease-2019 (COVID-19) with chronic infections, which place numerous individuals at high risk of severe COVID-19. Infection with Human Immunodeficiency Virus (HIV), a global epidemic, remains a major public health concern. Whether prior HIV+ status exacerbates COVID-19 warrants investigation. Herein, we characterized the impact of SARS-CoV-2 in human bronchial epithelial cells (HBECs) previously exposed to HIV. We optimized the air-liquid interface (ALI) cell culture technique to allow for challenges with HIV at the basolateral cell surface and SARS-CoV-2 spike protein on the apical surface, followed by genetic analyses for cellular stress/toxicity and innate/adaptive immune responses. Our results suggest that the IL-10 pathway was consistently activated in HBECs treated with spike, HIV, or a combination. Recombinant spike protein elicited COVID-19 cytokine storms while HIV activated different signaling pathways. HIV-treated HBECs could no longer activate NF-kB, pro-inflammatory TRAF-6 ubiquitination nor RIP1 signaling. Combinations of HIV and SARS-CoV-2 spike increased gene expression for activation of endoplasmic reticulum-phagosome pathway and downregulated non-canonical NF-kB pathways that are key in functional regulatory T cells and RNA Polymerase II transcription. Our in vitro studies suggest that prior HIV infection may not exacerbate COVID-19. Further in vivo studies are warranted to advance this field.

Keywords: HIV; SARS-CoV-2; adaptive; air liquid interphase (ALI); co-infection; immune; innate; polyparasitism.


Conflict of interest statement

The authors declare no conflict of interest.

Figures

Figure 1
Figure 1
Schematic representation of the ALI System and process for co-challenge with HIV and SARS-CoV-2 Spike protein. The steps to culture HBE4 cells under ALI conditions are shown. (A) depicts HBE4 cells cultured on 0.4 um membrane inserts (transwells) using supplemented keratinocyte medium and allowed to reach confluency after 7 days as depicted in (B). (C) shows confluent HBE4 cells changed to ALI conditions by replacing the supplemented keratinocyte medium by fresh mAir media mixture applied only to the bottom chamber of the transwell. (D) shows differentiated HBE4 cells after 21 days under ALI conditions, with media changes every 48 h. At this point, cells were either treated with spike protein alone, or HIV, or their combination as follows. (E1) shows differentiated HBE4 cells resubmerged for exposure to SARS-CoV-2 spike protein (or vehicle) on the apical surface for 4 h. (E2) shows cells under restored ALI conditions (spike protein removed) for 48 h prior to processing for molecular studies. (F1) shows differentiated HBE4 cells exposed to cell-free HIV on the basolateral surface for 44 h. (F2) shows HIV-treated cells resubmerged for exposure to SARS-CoV-2 spike protein (or vehicle) on the apical surface for 4 h, for a total co-exposure time of 48 h. (F3) shows co-challenged cells under restored ALI conditions (HIV and spike protein removed) for an additional 48 h prior to processing for molecular studies. (G) shows a photograph of the transwell system and (H) shows cells with visible mucus production. Abbreviations: ALI, air-liquid interface, HBEC, human bronchial epithelial cells.
Figure 2
Figure 2
Characterization of gene expression in HBE4 cells cultured in ALI conditions. Cells were cultured using standard cell culture techniques (submerged in medium, non-ALI) or in ALI. Cells were collected at the indicated time points and processed for RNA extractions followed by quantitative PCR as described in the Methods section. We measure gene expression for several stages in the differentiation process including ciliation (A), production of mucin (B), pulmonary neuroendocrine cells (C), Club cells (D), as well as expression of ACE-2 receptor (E). Fold changes were calculated using 2–∆∆Ct) formula, using a CT cutoff set to 35. Data normalization was done using the geometric means of all three housekeeping genes β2-microglobulin (B2M), glyceraldehyde-3-phosphate dehydrogenase (GAPDH), and Ribosomal protein lateral stalk subunit P0 (RPLP0). Data points are represented by black circles. Statistical differences were calculated using the “Kruskal–Wallis test Anova results” in GraphPad, p < 0.05 symbolized by *, p < 0.01 symbolized by **, p < 0.001 symbolized as *** and p < 0.0001 symbolized as ****.
Figure 3
Figure 3
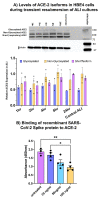
Functionality of recombinant SARS-CoV-2 spike protein and levels of ACE2 expression in ALI cultures. (A) shows the levels of expression of ACE2 isoforms (glycosylated, non-glycosylated, and short), as detected by Western blot, in 21-day ALI cultures that were resubmerged for the indicated times. Data are shown as ACE2 expression normalized to β-actin, SEM. Statistical differences were assessed using Kruskal–Wallis tests for multiple comparisons. (B) shows the results of recombinant SARS-CoV-2 binding to ACE-2 assays done by ELISA, as described in the Methods section. Data are indicated as mean absorbance at 450 nm, SEM; each datapoint is represented with black circles. Statistical differences were calculated using Student’s t-Test in GraphPad Prism, p < 0.05 symbolized by * and p < 0.01 symbolized by **.
Figure 4
Figure 4
Changes in RNA Expression in HBECs treated with SARS-CoV-2 S1 protein, HIV, and HIV S1. (A) summarizes the results for HBECs treated with HIV only; (B) for co-challenge with infectious HIV and SARS-CoV-2 S1 spike protein; and (C) for HBECs treated with SARS-CoV-2 S1 spike protein only. The heat map depicts the log2 of the fold changes. The Volcano Plot identifies significant gene expression changes by plotting the log2 of the fold changes in gene expression on the x-axis versus their statistical significance on the y-axis. The two outer vertical lines indicate the selected fold regulation threshold. The horizontal line indicates the selected p-value threshold. Genes with data points in the far upper left (down-regulated) and far upper right (up-regulated) sections meet the selected fold regulation and p-value thresholds. Red dots symbolize significantly upregulated and blue dots symbolize significantly downregulated genes; the gray dots represent genes that did not meet the fold change criteria and the black dots represent unchanged genes in the panel. The tables below list the significant fold regulations for each version of the HBEC challenge. Sample size: untreated control n = 8; S1 protein only n = 5; HIV only n = 4; HIV + S1 protein n = 6.
Figure 5
Figure 5
Predicted pathways that are significantly influenced by SARS-CoV-2 S1 protein, HIV and HIV + S1 treated HBECs: The bar graphs show Reactome pathways found to be significantly affected by the corresponding treatment. The x-axis shows the significance as the −log10 of the p-value. (A,B) visualize the pathways affected by changes in gene expression in HBECs challenged with HIV, (C,D) for HBECs challenged with HIV and SARS-CoV-2, and (E) HBECs challenged with SARS-CoV-2 S1 protein. All pathways and their p-values were found at https://reactome.org (accessed on 21 August 2022).
Figure 6
Figure 6
Enrichment pathways analyses in HBECs treated with HIV, SARS-CoV-2 S1 spike protein, or combination. We used the gene lists obtained from our gene expression analyses to perform over-representation pathway analyses using the Reactome pathway database (available at https://reactome.org/ (accessed on 21 August 2022)). The enriched pathways shown in Venn diagrams in the top panel indicate the upregulated pathways; the bottom panel shows downregulated signaling pathways. The blue shapes represent data from HBECs exposed to SARS-CoV-2 S1 Spike protein only; the red shapes represent data from HBECs treated with infectious HIV only, and the yellow shapes represent data from HBECs treated with the combination. The blended colors (orange and dark gray) represent signaling pathways that are common between the indicated treatments.

Similar articles

Cited by

References

    1. Khan M.M.A., Khan M.N., Mustagir M.G., Rana J., Islam M.S., Kabir M.I. Effects of underlying morbidities on the occurrence of deaths in COVID-19 patients: A systematic review and meta-analysis. J. Glob. Health. 2020;10:020503. doi: 10.7189/jogh.10.020503. - DOI - PMC - PubMed
    1. Djaharuddin I., Munawwarah S., Nurulita A., Ilyas M., Tabri N.A., Lihawa N. Comorbidities and mortality in COVID-19 patients. Gac. Sanit. 2021;35:S530–S532. doi: 10.1016/j.gaceta.2021.10.085. - DOI - PMC - PubMed
    1. UNAIDS. UNAIDS Data 2021. 2022.

    1. Raffe S., Sabin C., Gilleece Y. Comorbidities in women living with HIV: A systematic review. HIV Med. 2022;23:331–361. doi: 10.1111/hiv.13240. - DOI - PMC - PubMed
    1. Rodés B., Cadiñanos J., Esteban-Cantos A., Rodríguez-Centeno J., Arribas J.R. Ageing with HIV: Challenges and biomarkers. EBioMedicine. 2022;77:103896. doi: 10.1016/j.ebiom.2022.103896. - DOI - PMC - PubMed

LinkOut - more resources