

Stochastic Inoculum, Biotic Filtering and Species-Specific Seed Transmission Shape the Rare Microbiome of Plants
- PMID: 36143410
- PMCID: PMC9506401
- DOI: 10.3390/life12091372
Stochastic Inoculum, Biotic Filtering and Species-Specific Seed Transmission Shape the Rare Microbiome of Plants
Abstract
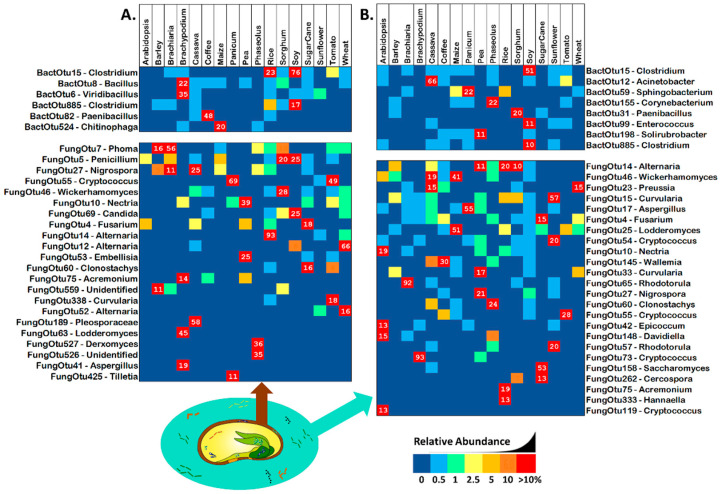
A plant's health and productivity is influenced by its associated microbes. Although the common/core microbiome is often thought to be the most influential, significant numbers of rare or uncommon microbes (e.g., specialized endosymbionts) may also play an important role in the health and productivity of certain plants in certain environments. To help identify rare/specialized bacteria and fungi in the most important angiosperm plants, we contrasted microbiomes of the seeds, spermospheres, shoots, roots and rhizospheres of Arabidopsis, Brachypodium, maize, wheat, sugarcane, rice, tomato, coffee, common bean, cassava, soybean, switchgrass, sunflower, Brachiaria, barley, sorghum and pea. Plants were grown inside sealed jars on sterile sand or farm soil. Seeds and spermospheres contained some uncommon bacteria and many fungi, suggesting at least some of the rare microbiome is vertically transmitted. About 95% and 86% of fungal and bacterial diversity inside plants was uncommon; however, judging by read abundance, uncommon fungal cells are about half of the mycobiome, while uncommon bacterial cells make up less than 11% of the microbiome. Uncommon-seed-transmitted microbiomes consisted mostly of Proteobacteria, Firmicutes, Bacteriodetes, Ascomycetes and Basidiomycetes, which most heavily colonized shoots, to a lesser extent roots, and least of all, rhizospheres. Soil served as a more diverse source of rare microbes than seeds, replacing or excluding the majority of the uncommon-seed-transmitted microbiome. With the rarest microbes, their colonization pattern could either be the result of stringent biotic filtering by most plants, or uneven/stochastic inoculum distribution in seeds or soil. Several strong plant-microbe associations were observed, such as seed transmission to shoots, roots and/or rhizospheres of Sarocladium zeae (maize), Penicillium (pea and Phaseolus), and Curvularia (sugarcane), while robust bacterial colonization from cassava field soil occurred with the cyanobacteria Leptolyngbya into Arabidopsis and Panicum roots, and Streptomyces into cassava roots. Some abundant microbes such as Sakaguchia in rice shoots or Vermispora in Arabidopsis roots appeared in no other samples, suggesting that they were infrequent, stochastically deposited propagules from either soil or seed (impossible to know based on the available data). Future experiments with culturing and cross-inoculation of these microbes between plants may help us better understand host preferences and their role in plant productivity, perhaps leading to their use in crop microbiome engineering and enhancement of agricultural production.
Keywords: endophyte; phyllosphere; plant microbiome; plant mycobiome; rare microbiome; rhizosphere; seed microbiome; soil microbiology; vertical transmission.
Conflict of interest statement
The authors declare that the research was conducted in the absence of any commercial or financial relationships that could be construed as a potential conflict of interest.
Figures


Similar articles
-
Seed-Transmitted Bacteria and Fungi Dominate Juvenile Plant Microbiomes.Front Microbiol. 2021 Oct 22;12:737616. doi: 10.3389/fmicb.2021.737616. eCollection 2021. Front Microbiol. 2021. PMID: 34745040 Free PMC article.
-
Domestication Impacts the Wheat-Associated Microbiota and the Rhizosphere Colonization by Seed- and Soil-Originated Microbiomes, Across Different Fields.Front Plant Sci. 2022 Jan 12;12:806915. doi: 10.3389/fpls.2021.806915. eCollection 2021. Front Plant Sci. 2022. PMID: 35095978 Free PMC article.
-
Dynamics of rice microbiomes reveal core vertically transmitted seed endophytes.Microbiome. 2022 Dec 9;10(1):216. doi: 10.1186/s40168-022-01422-9. Microbiome. 2022. PMID: 36482381 Free PMC article.
-
The root microbiome: Community assembly and its contributions to plant fitness.J Integr Plant Biol. 2022 Feb;64(2):230-243. doi: 10.1111/jipb.13226. J Integr Plant Biol. 2022. PMID: 35029016 Review.
-
Wheat Microbiome: Structure, Dynamics, and Role in Improving Performance Under Stress Environments.Front Microbiol. 2022 Jan 13;12:821546. doi: 10.3389/fmicb.2021.821546. eCollection 2021. Front Microbiol. 2022. PMID: 35095825 Free PMC article. Review.
Cited by
-
Endophytic bacilli from Cyamopsis tetragonoloba (L.) Taub. induces plant growth and drought tolerance.Int Microbiol. 2024 Oct;27(5):1541-1556. doi: 10.1007/s10123-024-00499-6. Epub 2024 Mar 12. Int Microbiol. 2024. PMID: 38472714
-
Effects of Inbreeding on Microbial Community Diversity of Zea mays.Microorganisms. 2023 Mar 29;11(4):879. doi: 10.3390/microorganisms11040879. Microorganisms. 2023. PMID: 37110300 Free PMC article.
-
The Arabidopsis holobiont: a (re)source of insights to understand the amazing world of plant-microbe interactions.Environ Microbiome. 2023 Feb 17;18(1):9. doi: 10.1186/s40793-023-00466-0. Environ Microbiome. 2023. PMID: 36803555 Free PMC article. Review.
-
Spinach seed microbiome characteristics linked to suppressiveness against Globisporangium ultimum damping-off.FEMS Microbiol Ecol. 2025 Jan 28;101(2):fiaf004. doi: 10.1093/femsec/fiaf004. FEMS Microbiol Ecol. 2025. PMID: 39779304 Free PMC article.
-
Unlocking the potential of bacterial endophytes from medicinal plants for drug discovery.Microb Biotechnol. 2024 Feb;17(2):e14382. doi: 10.1111/1751-7915.14382. Epub 2024 Feb 12. Microb Biotechnol. 2024. PMID: 38345183 Free PMC article. Review.
References
-
- Johnston-Monje D., Arévalo A.L., Bolaños A.C. Microbiome Stimulants for Crops. Elsevier; Amsterdam, The Netherlands: 2021. Friends in low places: Soil derived microbial inoculants for biostimulation and biocontrol in crop production; pp. 15–31.
-
- Kuldau G., Bacon C. Clavicipitaceous endophytes: Their ability to enhance resistance of grasses to multiple stresses. Biol. Control. 2008;46:57–71. doi: 10.1016/j.biocontrol.2008.01.023. - DOI
-
- Weller D.M. Take-All Decline and Beneficial Pseudomonads. In: Lugtenberg B., editor. Principles of Plant-Microbe Interactions: Microbes for Sustainable Agriculture. Springer International Publishing; Cham, Switzerland: 2015. pp. 363–370.
LinkOut - more resources
Full Text Sources
