Review
. 2022 Aug 26;13(9):1401.
doi: 10.3390/mi13091401.

Advances in Cancer Diagnosis: Bio-Electrochemical and Biophysical Characterizations of Cancer Cells

Affiliations
Review

Advances in Cancer Diagnosis: Bio-Electrochemical and Biophysical Characterizations of Cancer Cells

Kholoud K Arafa et al. Micromachines (Basel). .

Abstract

Cancer is a worldwide leading cause of death, and it is projected that newly diagnosed cases globally will reach 27.5 million each year by 2040. Cancers (malignant tumors), unlike benign tumors are characterized by structural and functional dedifferentiation (anaplasia), breaching of the basement membrane, spreading to adjacent tissues (invasiveness), and the capability to spread to distant sites (metastasis). In the cancer biology research field, understanding and characterizing cancer metastasis as well as features of cell death (apoptosis) is considered a technically challenging subject of study and clinically is very critical and necessary. Therefore, in addition to the cytochemical methods traditionally used, novel biophysical and bioelectrochemical techniques (e.g., cyclic voltammetry and electrochemical impedance spectroscopy), atomic force microscopy, and electron microscopic methods are increasingly being deployed to better understand these processes. Implementing those methods at the preclinical level enables the rapid screening of new anticancer drugs with understanding of their central mechanism for cancer therapy. In this review, principles and basic concepts of new techniques suggested for metastasis, and apoptosis examinations for research purposes are introduced, along with examples of each technique. From our recommendations, the privilege of combining the bio-electrochemical and biosensing techniques with the conventional cytochemical methods either for research or for biomedical diagnosis should be emphasized.

Keywords: apoptosis; atomic force microscopy; cancer biology; electrochemical biosensors; electron microscopy; in-vitro assessment; metastasis.


Conflict of interest statement

The authors declare no conflict of interest.

Figures

Figure 1
Figure 1
The steps leading to cancer metastasis. Initially, cancer cells breach the basement membrane and migrate across the cancer stroma. Next, intravasation into the blood vessels occurs and is followed by migration of the circulating cancer cells in the bloodstream until reaching the secondary metastatic site. Afterwards, extravasation of cancer cells through the endothelial barrier ensues; finally, colonization in the metastatic target organ forming a secondary cancer takes place [10].
Figure 2
Figure 2
Overview of apoptosis signaling pathways and the effects of pro-survival signaling, immune cells and the tumor microenvironment. (Phosphatidylserine Fas ligand (FasL), cancer necrosis factor (TNF) and TNF-related apoptosis-inducing ligand (TRAIL), FAS-associated death domain protein (FADD), death-inducing signaling complex (DISC), activated caspase 8 (also called FADD-like IL-1 converting enzyme (FLICE)), FLICE-like inhibitory protein (FLIP), pro-apoptotic B-cell lymphoma-2 (Bcl-2) family members (Bax and Bak), apoptotic protease activating factor-1 (APAF-1), second mitochondria-derived activator of caspase (Smac), and inhibitor of apoptosis proteins (IAPs).
Figure 3
Figure 3
(a) The important components of a designed biosensor. A single or a multiple bio-receptors (could be whole cells, microorganisms, enzymes, or antibodies). A transducer of the physicochemical signals resulted from the analyte and bio-recognition elements interaction(s). Data processor to interpret and amplify the results that have been converted [52,54]. (b) Schematic representation of Caspase-3 electrochemical biosensor. (I) Cas-3 detection occurs through electrocatalytic activity by the cleavage product ATCUN-Cu. (II) cyclic voltammograms of Cas-3 activity when the Hela cells were incubated with 5 μM of individual anticancer agents. (III) The average of the oxidation current generated from the Cas-3 in treated HeLa cells with different concentrations of the four cancer drugs. (c) Aptasensor representative images and impedance measurements. The SEM images of (I) bare Au electrode and (II) Au-Apt@AgNCs modified electrode. (III) Nyquist plots for Au-Cys-Apt@AgNC after incubation with different concentrations of Cyt-C. (d) Schematic representation of the dual-signal-marked electrochemical immunosensor. Anti-Bax II and Anti-Bcl-2 II recognition antibodies are immobilized on glassy carbon electrodes (GCE) for the recognition of their cognate proteins in the sample. Subsequently, a signal is detected upon the formation of an immune-sandwich with the QD-modified primary antibodies anti-Bax I and anti-Bcl-2 I. (e) Voltammetric and impedimetric determination of epithelial cell adhesion molecule (EpCAM). (I) The Nyquist impedance spectra of the gold electrode modified at different stages in the presence of PBS containing 5 mM [Fe(CN)6]4−/3− and 0.1 M KCl. Inset is the equivalent circuit model used to fit the impedance data. (II) Typical voltammetric measurements of the following conditions (a) Bare Au electrode; (b) MPA/Au electrode; (c) G6 PAMAM modification; (d) G6 PAMAM-COOH/MPA/Au electrode; (e) post-Anti-EpCAM addition; (f) post blocking the non-specific binding site by BSA; (g) after exposure to Hep-G2 cells (1.0 × 10⁶/ml) [66]. (f) Schematic demonstration of the IL-13Rα2 sandwich immunosensor. Functionalized recognition microbeads specific to IL-13Rα2 are introduced in-vitro to KM12SM metastatic cells. This leads to an immunocomplex formation. Consequently, certain reactions occur which provoke the amperometric transduction of signals. “The figure has been adapted with permission from Ref. [69]. 2022, Springer”. (g) Electrochemical biosensing approach for the electron-mediated determination of a metastasis-linked protease in pancreatic cancer cells. Neutravidin-MBS is linked by a biotin linker to synthetic peptide chains terminating with fluorescein isothiocyanate (FITC). The low amount of attached FITC after cleavage of his trypsin in cancerous pancreatic cells results in low amperometric response and vice versa in case of healthy cells [69].
Figure 3
Figure 3
(a) The important components of a designed biosensor. A single or a multiple bio-receptors (could be whole cells, microorganisms, enzymes, or antibodies). A transducer of the physicochemical signals resulted from the analyte and bio-recognition elements interaction(s). Data processor to interpret and amplify the results that have been converted [52,54]. (b) Schematic representation of Caspase-3 electrochemical biosensor. (I) Cas-3 detection occurs through electrocatalytic activity by the cleavage product ATCUN-Cu. (II) cyclic voltammograms of Cas-3 activity when the Hela cells were incubated with 5 μM of individual anticancer agents. (III) The average of the oxidation current generated from the Cas-3 in treated HeLa cells with different concentrations of the four cancer drugs. (c) Aptasensor representative images and impedance measurements. The SEM images of (I) bare Au electrode and (II) Au-Apt@AgNCs modified electrode. (III) Nyquist plots for Au-Cys-Apt@AgNC after incubation with different concentrations of Cyt-C. (d) Schematic representation of the dual-signal-marked electrochemical immunosensor. Anti-Bax II and Anti-Bcl-2 II recognition antibodies are immobilized on glassy carbon electrodes (GCE) for the recognition of their cognate proteins in the sample. Subsequently, a signal is detected upon the formation of an immune-sandwich with the QD-modified primary antibodies anti-Bax I and anti-Bcl-2 I. (e) Voltammetric and impedimetric determination of epithelial cell adhesion molecule (EpCAM). (I) The Nyquist impedance spectra of the gold electrode modified at different stages in the presence of PBS containing 5 mM [Fe(CN)6]4−/3− and 0.1 M KCl. Inset is the equivalent circuit model used to fit the impedance data. (II) Typical voltammetric measurements of the following conditions (a) Bare Au electrode; (b) MPA/Au electrode; (c) G6 PAMAM modification; (d) G6 PAMAM-COOH/MPA/Au electrode; (e) post-Anti-EpCAM addition; (f) post blocking the non-specific binding site by BSA; (g) after exposure to Hep-G2 cells (1.0 × 10⁶/ml) [66]. (f) Schematic demonstration of the IL-13Rα2 sandwich immunosensor. Functionalized recognition microbeads specific to IL-13Rα2 are introduced in-vitro to KM12SM metastatic cells. This leads to an immunocomplex formation. Consequently, certain reactions occur which provoke the amperometric transduction of signals. “The figure has been adapted with permission from Ref. [69]. 2022, Springer”. (g) Electrochemical biosensing approach for the electron-mediated determination of a metastasis-linked protease in pancreatic cancer cells. Neutravidin-MBS is linked by a biotin linker to synthetic peptide chains terminating with fluorescein isothiocyanate (FITC). The low amount of attached FITC after cleavage of his trypsin in cancerous pancreatic cells results in low amperometric response and vice versa in case of healthy cells [69].
Figure 4
Figure 4
(a) Schematic diagram of AFM working principles. The AFM instrument is composed of a main probe (cantilever), a laser source, a piezoelectric material, and a quadruple photodiode detector. The AFM probe is a flexible cantilever with a sharp micro-tip that is attached at its end. The tip, which has a monomolecular point, allows for nanometer resolution imaging and the micro-cantilever is a force sensor that can detect even minute deformation of a sample, enabling very high sensitivity AFM in force measurement. (b) Schematic illustrations of the AFM-based biomechanical assays. (I) Indentation experiments were used to characterize the compliance of a single cell. (II) Single molecule force spectroscopy assesses interactions between a functionalized probe and the membrane receptors. Single-cell force spectroscopy was utilized to quantify (III) cell–cell adhesions and (IV) cell–substrate adhesions.
Figure 4
Figure 4
(a) Schematic diagram of AFM working principles. The AFM instrument is composed of a main probe (cantilever), a laser source, a piezoelectric material, and a quadruple photodiode detector. The AFM probe is a flexible cantilever with a sharp micro-tip that is attached at its end. The tip, which has a monomolecular point, allows for nanometer resolution imaging and the micro-cantilever is a force sensor that can detect even minute deformation of a sample, enabling very high sensitivity AFM in force measurement. (b) Schematic illustrations of the AFM-based biomechanical assays. (I) Indentation experiments were used to characterize the compliance of a single cell. (II) Single molecule force spectroscopy assesses interactions between a functionalized probe and the membrane receptors. Single-cell force spectroscopy was utilized to quantify (III) cell–cell adhesions and (IV) cell–substrate adhesions.
Figure 5
Figure 5
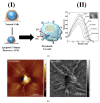
(a) Biophysical assessment of apoptotic volume decrease (AVD) in staurosporine treated cancer cells. (I) schematic depiction of biophysical and biochemical changes taking place during apoptosis chronologically. (II) Line scans for AFM images of KB cells exposed to 1 µM staurosporine (STS). Inset shows line scans taken across dashed lines. (b) AFM images depict GBM U87-derived exosomes with multiple nano-filamentous structured surface protrusions. Quantitative mapping of several biophysical parameters, including topography (range z = 5 nm) and modulus (z = 2 GPa) are presented.
Figure 6
Figure 6
(a) Specific activation of MRCS in response to mechanical cues in the metastatic niche in-vivo. Frozen lung sections of tumor-bearing NSG mice cancer region (I) and noncancer region (II) and tumor-free NSG mice (III) after infusion of MRCS-CD cotransfected with eGFP were stained with anti-Luc (red) to detect lung metastasis, anti-CD (magenta) for CD expressed by MRCS-CD, and anti-eGFP (green) for MRCS-CD tracking. SHG imaging of collagen networks (cyan) was also overlaid on IHC imaging. (IV) and (V) Frequency of Young’s modulus values of cancer bearing and tumor-free (VI) lungs from AFM microindentation in the range of 0 to 40 kPa (bin size = 1 kPa), whereas the inset graphs show the frequency within the range of 0 to 10 kPa (bin size = 0.5 kPa). The Figure is adapted with permission from Ref. [87]. 2022, Elsevier. (b) AFM technique deployed to investigate the molecular interaction between the pro-oncogenic miR-21-3p and the tumor suppressor p53. Schematic depiction of the surface chemistry used to covalently bind (I) miR-21-3p and DBD of p53 (ii) to AFM tips and substrate, respectively. (III) SMFS histogram of the unbinding forces for the DBD-miR-21-3p complex [87].
Figure 6
Figure 6
(a) Specific activation of MRCS in response to mechanical cues in the metastatic niche in-vivo. Frozen lung sections of tumor-bearing NSG mice cancer region (I) and noncancer region (II) and tumor-free NSG mice (III) after infusion of MRCS-CD cotransfected with eGFP were stained with anti-Luc (red) to detect lung metastasis, anti-CD (magenta) for CD expressed by MRCS-CD, and anti-eGFP (green) for MRCS-CD tracking. SHG imaging of collagen networks (cyan) was also overlaid on IHC imaging. (IV) and (V) Frequency of Young’s modulus values of cancer bearing and tumor-free (VI) lungs from AFM microindentation in the range of 0 to 40 kPa (bin size = 1 kPa), whereas the inset graphs show the frequency within the range of 0 to 10 kPa (bin size = 0.5 kPa). The Figure is adapted with permission from Ref. [87]. 2022, Elsevier. (b) AFM technique deployed to investigate the molecular interaction between the pro-oncogenic miR-21-3p and the tumor suppressor p53. Schematic depiction of the surface chemistry used to covalently bind (I) miR-21-3p and DBD of p53 (ii) to AFM tips and substrate, respectively. (III) SMFS histogram of the unbinding forces for the DBD-miR-21-3p complex [87].

Similar articles

Cited by

References

    1. Siegel R.L., Miller K.D., Fuchs H.E., Jemal A. Cancer Statistics. CA Cancer J. Clin. 2021;71:7–33. doi: 10.3322/caac.21654. - DOI - PubMed
    1. Sung H., Ferlay J., Siegel R.L., Laversanne M., Soerjomataram I., Jemal A., Bray F. Global Cancer Statistics 2020: GLOBOCAN Estimates of Incidence and Mortality Worldwide for 36 Cancers in 185 Countries. CA Cancer J. Clin. 2021;71:209–249. doi: 10.3322/caac.21660. - DOI - PubMed
    1. Shah S.A., Aslam Khan M.U., Arshad M., Awan S.U., Hashmi M.U., Ahmad N. Doxorubicin-loaded photosensitive magnetic liposomes for multi-modal cancer therapy. Colloids Surf. B Biointerfaces. 2016;148:157–164. doi: 10.1016/j.colsurfb.2016.08.055. - DOI - PubMed
    1. Ma Y., Zhu B., Yong L., Song C., Liu X., Yu H., Wang P., Liu Z., Liu X. Regulation of Intrinsic and Extrinsic Apoptotic Pathways in Osteosarcoma Cells Following Oleandrin Treatment. Int. J. Mol. Sci. 2016;17:1950. doi: 10.3390/ijms17111950. - DOI - PMC - PubMed
    1. Galluzzi L., Vitale I., Aaronson S.A., Abrams J.M., Adam D., Agostinis P., Alnemri E.S., Altucci L., Amelio I., Andrews D.W., et al. Molecular mechanisms of cell death: Recommendations of the Nomenclature Committee on Cell Death 2018. Cell Death Differ. 2018;25:486–541. - PMC - PubMed

LinkOut - more resources