Review
. 2022 Sep 19;13(9):1555.
doi: 10.3390/mi13091555.

Fabrication of Concave Microwells and Their Applications in Micro-Tissue Engineering: A Review

Affiliations
Review

Fabrication of Concave Microwells and Their Applications in Micro-Tissue Engineering: A Review

Weijin Guo et al. Micromachines (Basel). .

Abstract

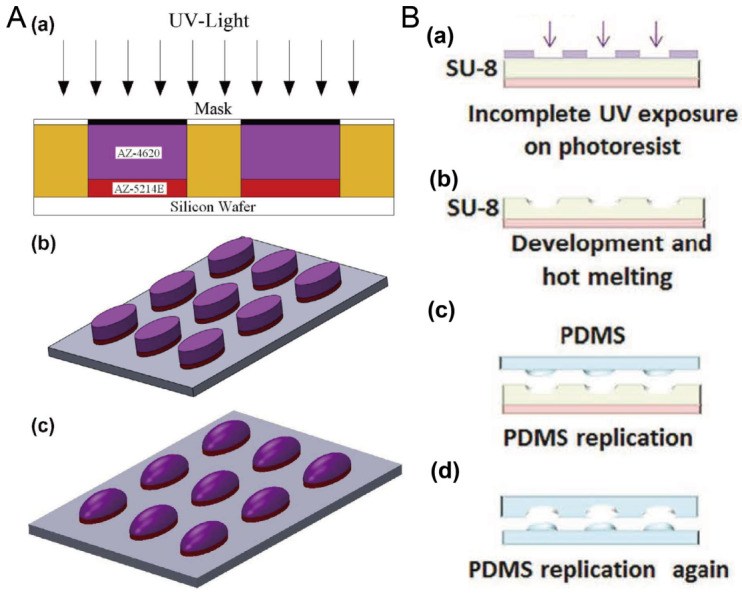
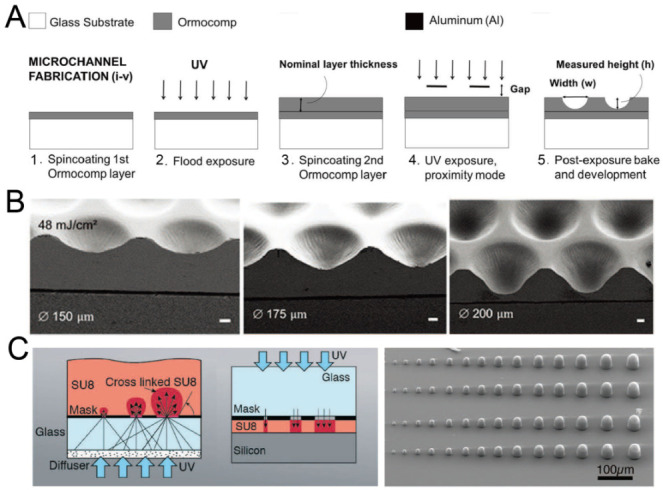
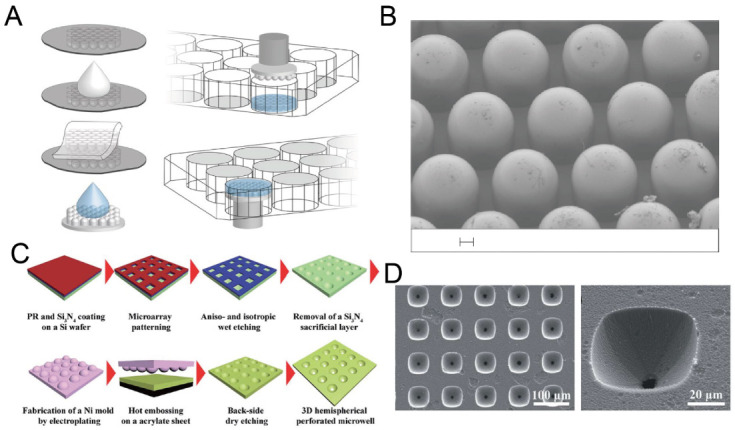
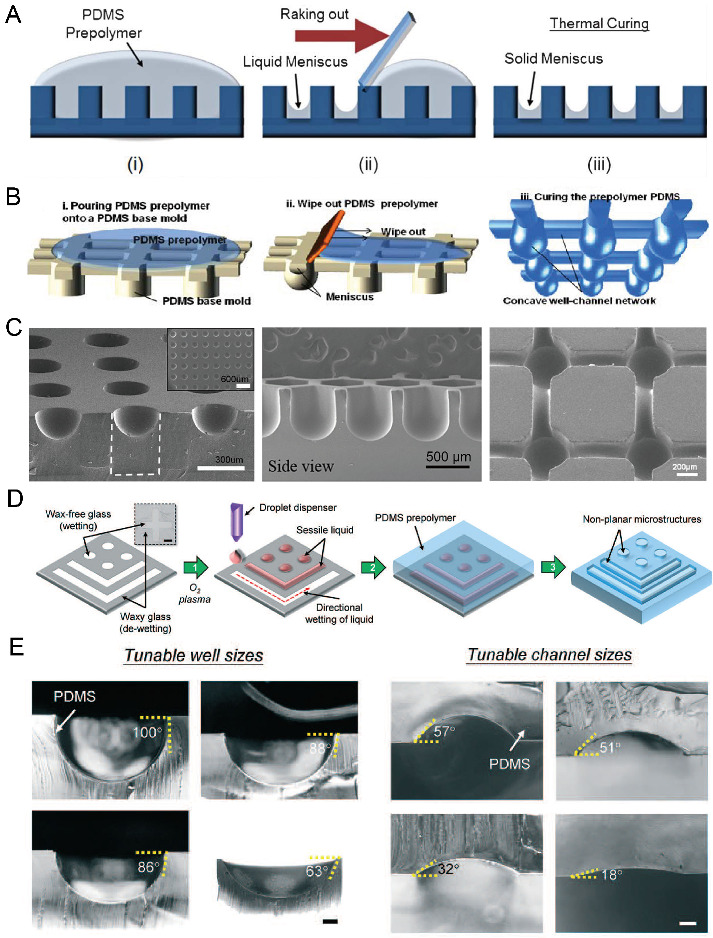
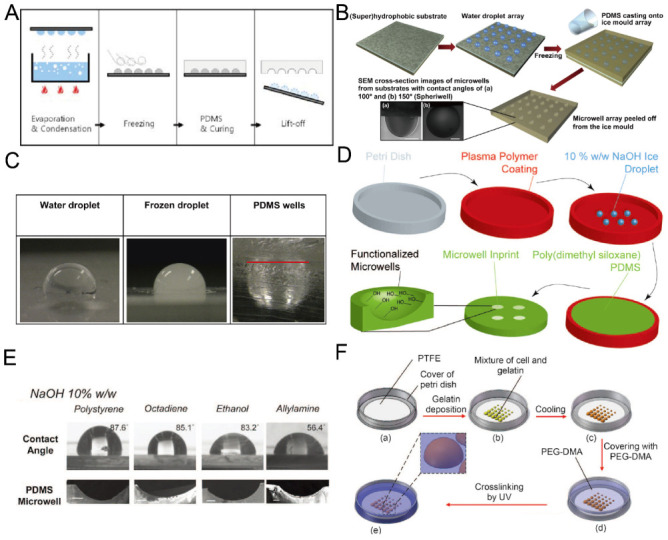
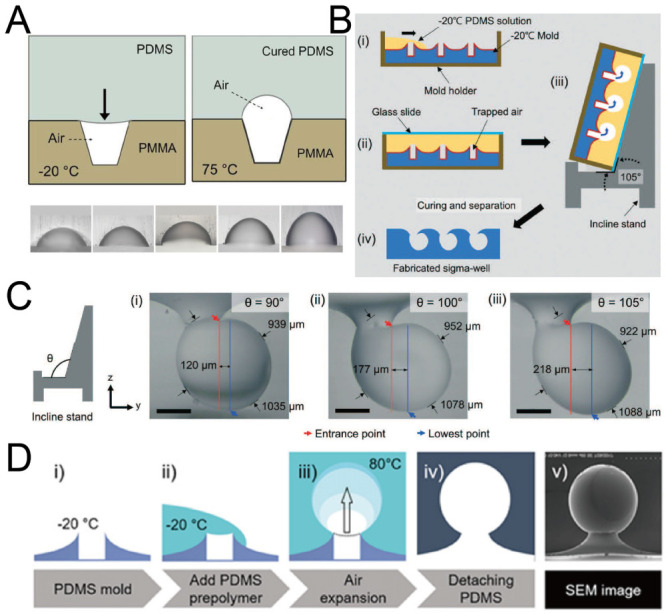
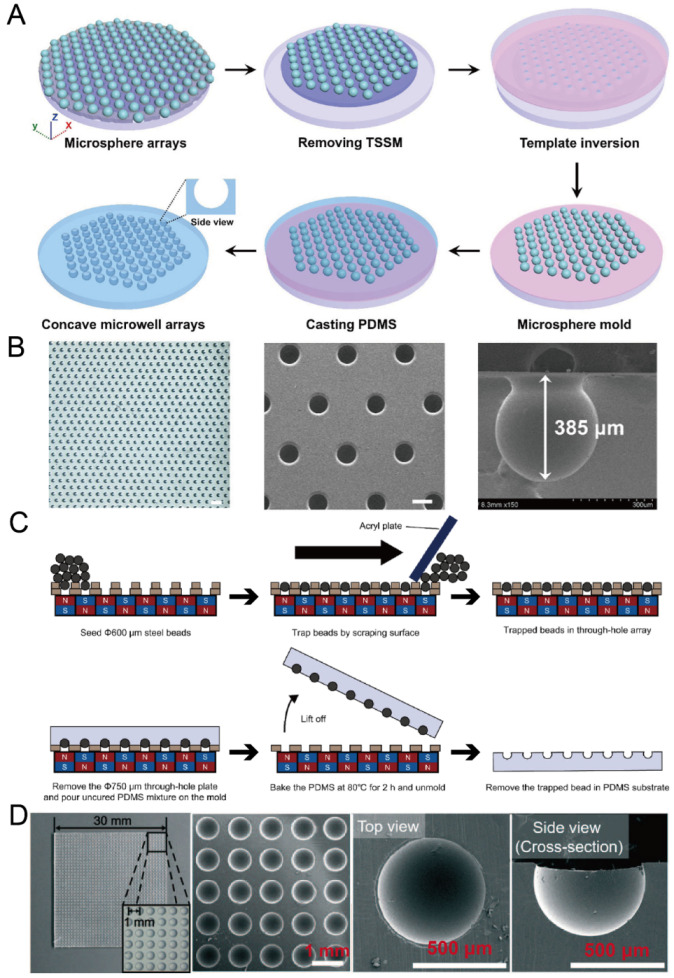
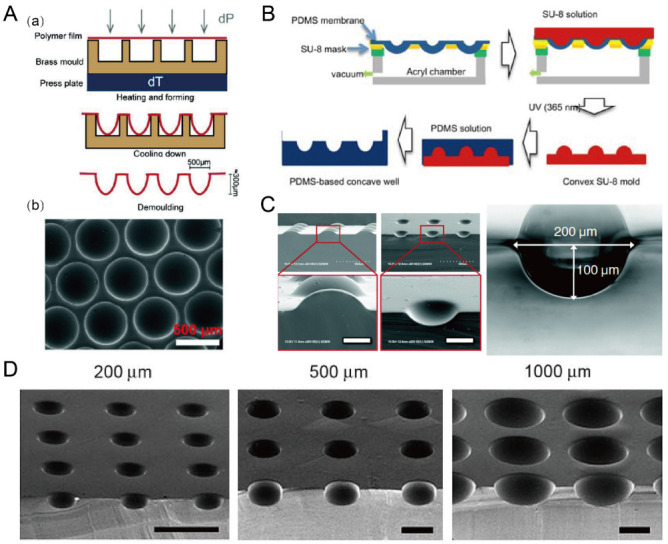
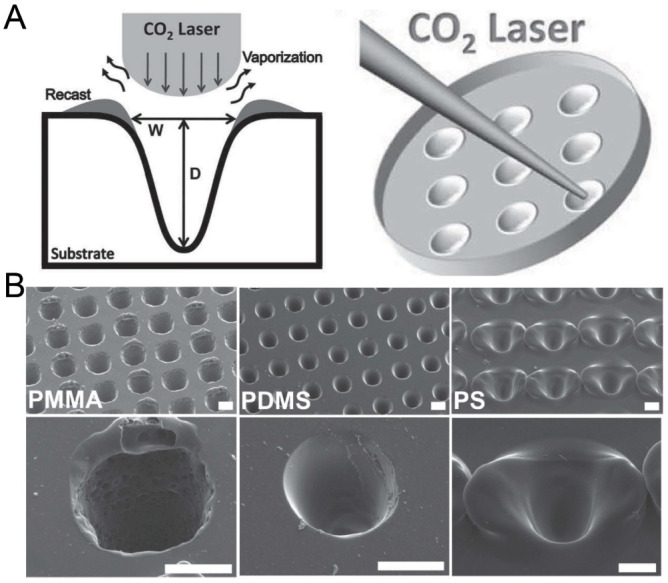
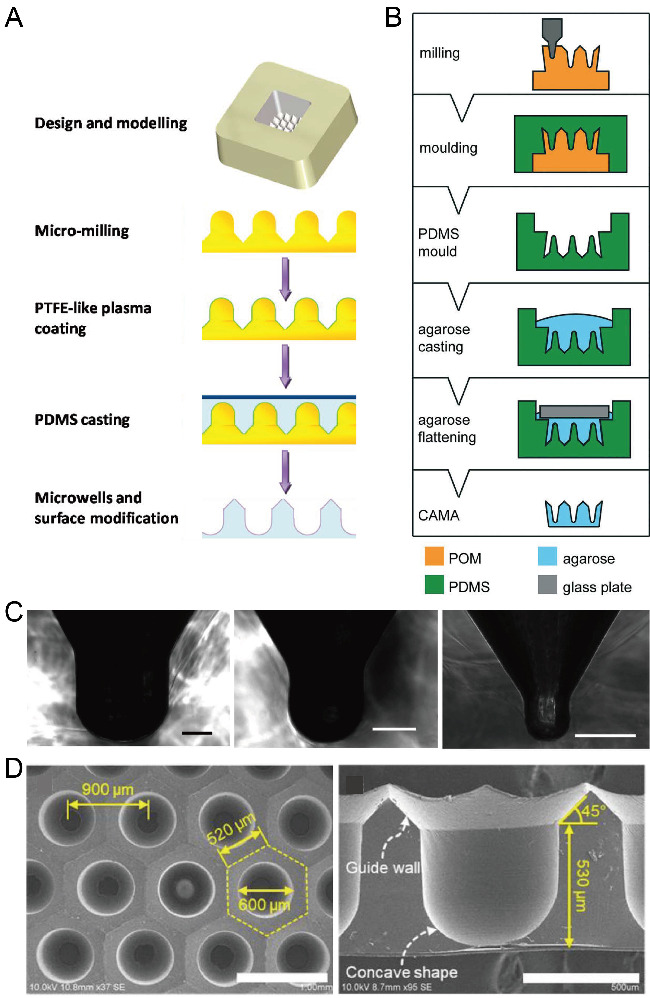
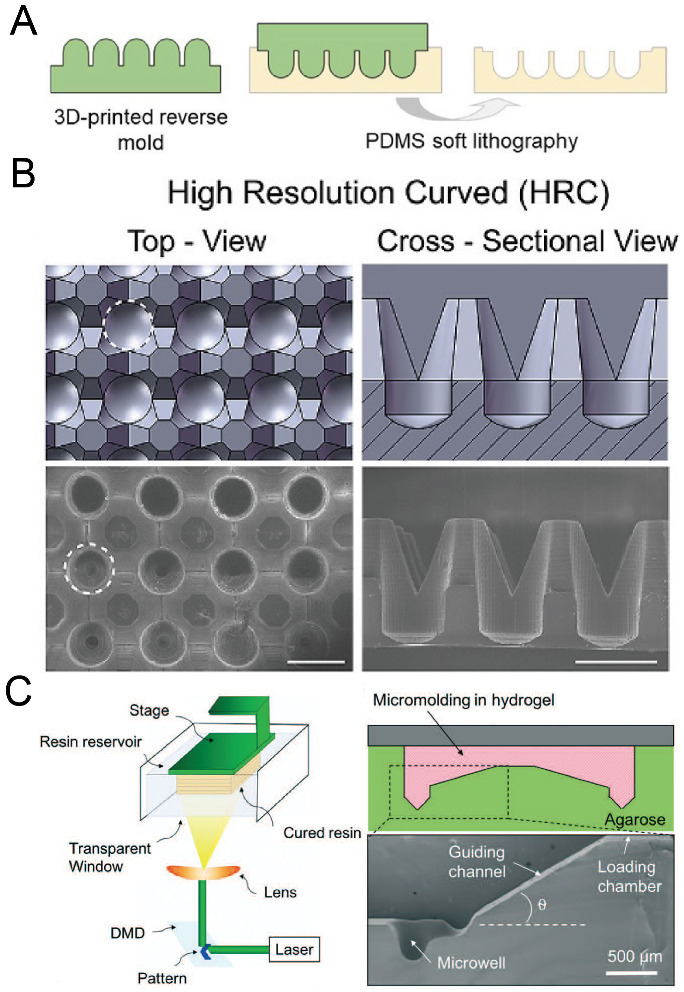
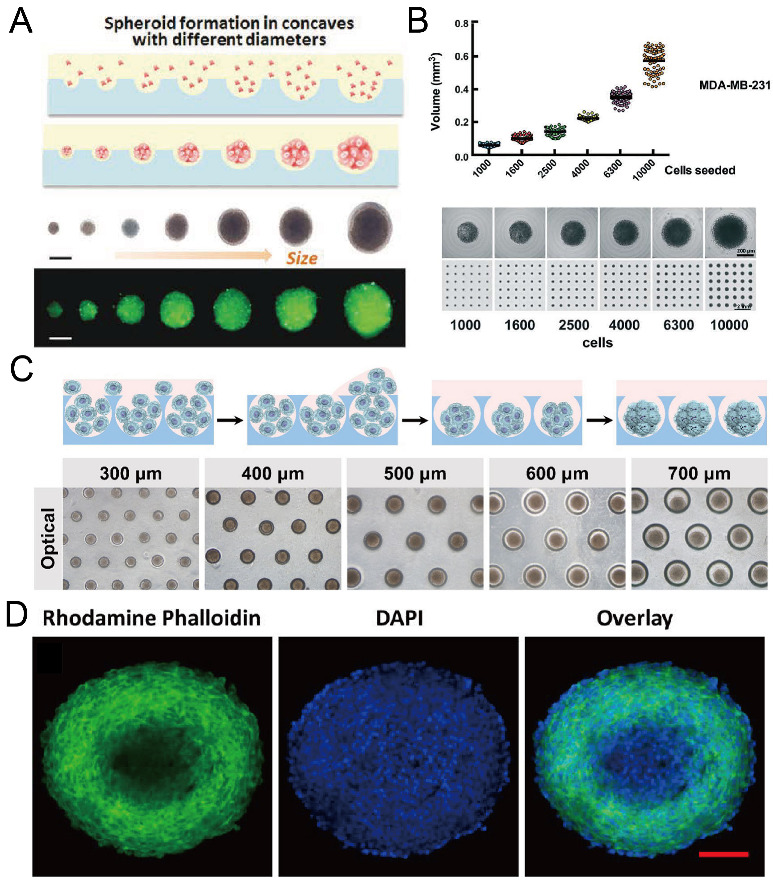
At present, there is an increasing need to mimic the in vivo micro-environment in the culture of cells and tissues in micro-tissue engineering. Concave microwells are becoming increasingly popular since they can provide a micro-environment that is closer to the in vivo environment compared to traditional microwells, which can facilitate the culture of cells and tissues. Here, we will summarize the fabrication methods of concave microwells, as well as their applications in micro-tissue engineering. The fabrication methods of concave microwells include traditional methods, such as lithography and etching, thermal reflow of photoresist, laser ablation, precision-computerized numerical control (CNC) milling, and emerging technologies, such as surface tension methods, the deformation of soft membranes, 3D printing, the molding of microbeads, air bubbles, and frozen droplets. The fabrication of concave microwells is transferring from professional microfabrication labs to common biochemical labs to facilitate their applications and provide convenience for users. Concave microwells have mostly been used in organ-on-a-chip models, including the formation and culture of 3D cell aggregates (spheroids, organoids, and embryoids). Researchers have also used microwells to study the influence of substrate topology on cellular behaviors. We will briefly review their applications in different aspects of micro-tissue engineering and discuss the further applications of concave microwells. We believe that building multiorgan-on-a-chip by 3D cell aggregates of different cell lines will be a popular application of concave microwells, while integrating physiologically relevant molecular analyses with the 3D culture platform will be another popular application in the near future. Furthermore, 3D cell aggregates from these biosystems will find more applications in drug screening and xenogeneic implantation.

Keywords: 3D printing; CNC milling; cellular behavior; embryoid; etching; lithography; organoid; photoresist reflow; spheroid; surface tension.


Conflict of interest statement

The authors declare no conflict of interest.

Figures

Figure 1
Figure 1
Thermal reflow of photoresist for fabrication of concave microwells. (A) Thermal reflow of photoresist AZ4620: at first AZ4620 and AZ5214E were patterned on a silicon wafer using standard photolithography (a,b); then, AZ4620 was melted by heating to form a convex profile (c) [35], which can be used to fabricate concave microwells with PDMS replica molding. Reprinted (adapted) from [35]. Copyright (2014) with permission from Elsevier. (B) The thermal reflow of photoresist SU-8 3035: at first, SU-8 3035 was patterned on a glass substrate (a), and then melted by heating (b). After that, it can be used as a mold to fabricate the concave microwells using PDMS double-replication (c,d) [37]. Reprinted (adapted) from [37]. Copyright (2015) with permission from John Wiley and Sons.
Figure 2
Figure 2
Lithography in proximity mode or backside lithography for the fabrication of concave microwells. (A) UV exposure of polymer Ormocomp® in proximity mode: first, a thin layer of Ormocomp® was coated on a glass substrate; then, another Ormocompe® layer was coated and exposed to UV in proximity mode. After development, concave microwells were formed [38]. Reprinted (adapted) from [38]. Copyright (2017) with permission from AIP Publishing. (B) SEM pictures of concave microwells fabricated by the method described in (A) [39]. Scale bars: 20 µm. Reprinted (adapted) from [39] under the terms of the Creative Commons CC BY license. (C) The schematic view of SU-8 backside lithography: a glass diffuser was used, together with a glass mask, to diffuse the collimated UV light and crosslink dome-like SU-8 microstructures [40]. Reprinted (adapted) from [40]. Copyright (2019) with permission from the Royal Society of Chemistry.
Figure 3
Figure 3
Dry etching and wet etching for the fabrication of concave microwells. (A) Fabrication of concave microwells on hydrogel using a silicon mold [41]. First, a silicon mold with concave microwells was used for PDMS casting. Then, the PDMS piece was used as a stamp for molding hydrogel to make concave microwells on hydrogel. (B) An SEM picture of the PDMS stamp. Scale bar: 100 µm. Reprinted (adapted) from [41]. Copyright (2020) with permission from Springer Nature. (C) The procedures of an array of perforated concave microwells using dry etching and wet etching [42]. (D) The SEM pictures of concave microwells using the method illustrated in (C) [42]. Reprinted (adapted) from [42]. Copyright (2014) with permission from Royal Society of Chemistry.
Figure 4
Figure 4
Examples of concave microwell fabrication using surface tension methods. (A) PDMS prepolymer was poured on a cured PDMS plate with cylinder microwells, and raked out to form a solid meniscus [46]. Reprinted (adapted) from [46]. Copyright (2013) with permission from Royal Society of Chemistry. (B) PDMS prepolymer was poured on a cured PDMS plate to form concave microfluidic well-channel networks [47], and (C) SEM pictures of concave microwells and fluidic networks using this method [45,47,50]. Reprinted (adapted) from [47]. Copyright (2014) with permission from Springer Nature. Reprinted (adapted) from [45]. Copyright (2012) with permission from John Wiley and Sons. Reprinted (adapted) from [50] under the terms of the Creative Commons Attribution License. (D) Liquid was patterned on glass with wax patterns, and covered by a PDMS prepolymer to form concave wells and channels [53]. (E) Concave wells and channels with different dimensions are fabricated using the method described in (D) [53]. Scale bar (left): 200 µm, scale bar (right): 100 µm. Reprinted (adapted) from [53]. Copyright (2018) with permission from Royal Society of Chemistry.
Figure 5
Figure 5
Replica molding of frozen liquid droplets. (A) Water vapor was condensed on a rigid substrate to form droplets. PDMS was poured on the substrate after the droplets were frozen. PDMS with concave microwells was ready after curing and lift-off [56]. Reprinted (adapted) from [56]. Copyright (2008) with permission from Springer Nature. (B) A water droplet array was printed on a superhydrophobic substrate and frozen, and then used as a mold for PDMS replica molding [57]. (C) Pictures of a water droplet, frozen droplet and the corresponding wells using the method illustrated in (B) [57]. Reprinted (adapted) from [57]. Copyright (2014) with permission from Elsevier. (D) 10% w/w NaOH solution was deposited on a petri dish substrate with plasma polymer coating, frozen and used as a mold for PDMS replica molding to fabricate concave microwells [58]. (E) Concave microwells with different dimensions were formed on different substrates using the method described in (D) [58]. Scale bars: 200 µm. Reprinted (adapted) from [58] under the terms of the Creative Commons CC BY license. (F) A mixture of cell and gelatin was printed on a petri dish substrate, and cooled down to form hydrogel. Then, the substrate with a hydrogel array was used to mold UV-curable PEG-DMA to obtain concave microwells [59]. Reprinted (adapted) from [59] under the terms of the Creative Commons CC BY license.
Figure 6
Figure 6
Replica molding of air bubbles. (A) Micro-cavities were fabricated on a PMMA base, and PDMS was poured on it. With heating, the volume of air bubbles increased and PDMS cured at the same time [60]. Reprinted (adapted) from [60]. Copyright (2012) with permission from AIP Publishing. (B) Low-temperature PDMS was poured onto a volcanic mountain-like PDMS mold, and placed on an inclined stand. Air bubbles expanded and PDMS cured at the same time to form Sigma-shaped microwells [62]. (C) Pictures of Sigma-shaped microwells using inclined stands of different angles [62]. Scale bar: 350 µm. Reprinted (adapted) from [62]. Copyright (2021) with permission from Royal Society of Chemistry. (D) The procedures of fabrication of Omega-shaped microwells (i–iv), and an SEM image of a microwell (v) [61]. Reprinted (adapted) from [61]. Copyright (2018) with permission from IOP Publishing.
Figure 7
Figure 7
Replica molding of micro-beads. (A) At first, a microsphere array was formed on a glass plate utilizing a through-hole stainless steel mesh and dual adhesive tape; then, it was used for the replica molding of PDMS [63]. (B) A picture of a PDMS piece with concave microwells (left), an SEM picture of concave microwells (middle), and an SEM picture of a single microwell (right) [63]. The scale bar in the left picture is 1500 µm, and scale bar in the middle picture is 300 µm. Reprinted (adapted) from [63]. Copyright (2020) with permission from John Wiley and Sons. (C) At first, a magnetic bead array was formed using a through-hole plate under a magnetic field. After that, PDMS was poured, cured and lifted from the bead array. After removing the magnetic beads, concave microwells were ready on PDMS [65]. (D) Pictures of concave microwells in different magnifications prepared by the method illustrated in (C) [64]. Reprinted (adapted) from [64]. Copyright (2016) with permission from Royal Society of Chemistry.
Figure 8
Figure 8
Concave microwells fabricated by methods utilizing deformed PDMS membranes. (A) A thin polycarbonate film was deformed by pressure and heat, and then was cooled down and demoulded (a) to obtain an array of concave microwells (b) [68]. Reprinted (adapted) from [68] under the terms of the Creative Commons Attribution-NonCommercial-NoDerivs License. (B) The fabrication of convex SU-8 mold: at first the PDMS membrane was deformed by vacuum, and then SU-8 was filled on the membrane and crosslinked. After that, the convex SU-8 mold was used to prepare PDMS replicas with concave microwells [71]. Reprinted (adapted) from [71]. Copyright (2011) with permission from Springer Nature. (C) SEM pictures of the convex SU-8 mold and concave microwells fabricated by a similar method as that described in (B) [69]. Scale bars: 100 µm. Reprinted (adapted) from [69]. Copyright (2009) with permission from Royal Society of Chemistry. (D) SEM pictures of the concave microwells of different dimensions fabricated by a similar method as that described in (B) [70]. Scale bars: 500 µm. Reprinted (adapted) from [70]. Copyright (2010) with permission from Elsevier.
Figure 9
Figure 9
Fabrication of concave microwells by laser ablation [74]. (A) The schematic of the working principle of laser ablation for microwell fabrication. (B) The SEM pictures of concave microwells fabricated on PMMA, PDMS, and PS substrates by laser ablation. Scale bars: 100 µm. Reprinted (adapted) from [74]. Copyright (2013) with permission from John Wiley and Sons.
Figure 10
Figure 10
Fabrication of concave microwells by milling. (A) Firstly, a metallic mold was fabricated by precise CNC micromachining, and its surface was coated with polytetrafluoroethylene (PTFE)-like plasma. After that, the metallic mold was used for PDMS soft lithography to obtain the concave microwells [78]. (B) At first, a POM mold was prepared by CNC micromachining, and then used for double replica moldings of PDMS and agarose, respectively [81]. Reprinted (adapted) from [81]. Copyright (2018) with permission from Royal Society of Chemistry. (C) Pictures of a cross-section of concave microwells fabricated by the method illustrated in (A) [78]. Scale bars: 200 µm. Reprinted (adapted) from [78]. Copyright (2014) with permission from American Chemical Society. (D) Pictures of concave microwells fabricated by a similar method as that described in (B) [82]. The scale bar in the left picture shows 1 mm, and scale bar in the right picture shows 500 µm. Reprinted (adapted) from [82] under the terms of the Creative Commons CC BY license.
Figure 11
Figure 11
3D printing for the fabrication of concave microwells. (A) At first a rigid mold was prepared by 3D printing and then used for PDMS soft lithography to fabricate concave microwells [86]. (B) CAD views (upper) and SEM images (lower) of the concave microwells fabricated by the method illustrated in (A) [86]. Scale bars: 1 mm. Reprinted (adapted) from [86] under the terms of the Creative Commons CC BY-NC-ND license. (C) At first a mold was fabricated by 3D printing of a photocurable resin, and then the mold was used for the replica molding of agarose gel [87]. Reprinted (adapted) from [87]. Copyright (2018) with permission from Royal Society of Chemistry.
Figure 12
Figure 12
Formation of cancer spheroids in concave microwells. (A) Glioma spheroids of different diameters can be formed in concave microwells of different sizes [37]. Reprinted (adapted) from [37]. Copyright (2015) with permission from John Wiley and Sons. (B) The size of breast cancer spheroids can be controlled by the seeding density (of MDA-MB-231 cells) [81]. Reprinted (adapted) from [81] under the terms of the Creative Commons CC BY license. (C) Schematic view of HepG2 spheroid formation, and experimental pictures of HepG2 spheroids formed in concave microwells of different diameters [63]. Reprinted (adapted) from [63]. Copyright (2020) with permission from John Wiley and Sons. (D) Fluorescent images of an EMT-6 (mammary carcinoma cell line) spheroid of diameter above 400 µm, stained by DAPI and rhodamine phalloidin [78]. Scale bar: 100 µm. Reprinted (adapted) from [78]. Copyright (2014) with permission from American Chemical Society.
Figure 13
Figure 13
Cancer spheroids for drug screening. (A) The status of MCF-7 (human breast adenocarcinoma cells) spheroids was monitored after they were treated with doxorubicin (DOX). The size of these spheroids was monitored by a bright field microscope, and the uptake of DOX and the live/dead status of MCF-7 cells were monitored by a fluorescent microscope. After 3 days of DOX treatment, spheroids with nucleus and F-actin stained were compared with control groups. The influences of DOX concentration and treating time on the cell viability of spheroids and monolayers were investigated [87]. * p < 0.05. Scale bars: 500 µm. Reprinted (adapted) from [87]. Copyright (2018) with permission from Royal Society of Chemistry. (B) The schematic view of applying a 2D drug combination to SK-N-DZ (human neuroblastoma cell line) spheroids (upper), the influence of cisplatin and MG132 (a kind of proteasome inhibitor) on the cell viability of 2D and 3D culture mode (left below) respectively, and the influence of drug combination on the cell viability in spheroids after 24-h treatment (right below) [53]. ** p < 0.01. (C) The schematic view of investigating SK-N-DZ spheroid migration after drug treatment (upper), and the experimental pictures of SK-N-DZ spheroids with different drug treatments (control, cisplatin alone, MG132 alone, and a combination of cisplatin and MG132) (left below), and a comparison of the migration rate (right below) [53]. *** p < 0.001. Scale bar: 200 µm. Reprinted (adapted) from [53]. Copyright (2018) with permission from Royal Society of Chemistry.
Figure 14
Figure 14
Cancer spheroids formed by co-culture of A549 (human lung cancer cells) and MRC-5 (fibroblasts), and tri-culture of A549, MRC-5, and human umbilical vein endothelial cells (HUVECS) [89]. (A) The schematic view of the formation of cancer spheroids by co-culture and tri-coculture. (B) Bright-field pictures and SEM pictures of cancer spheroids by co-culture and tri-culture in concave microwells. (C) Fluorescent pictures of cell aggregates, in which the MRC-5 cells were labeled by a red cell tracker. Comparison of circularity (D), diameter (E) and area (F) of cancer spheroids by co-culture and tri-culture. * p < 0.05 and ** p < 0.005. Reprinted (adapted) from [89] under the terms of the Creative Commons Attribution License.
Figure 15
Figure 15
The formation of chondrocyte spheroids under a hypoxia environment in concave microwells. (A) Schematic view of the experimental setup for chondrocyte spheroid culture. (B) Fluorescent images of chondrocyte cells in 2D and 3D culture mode (i), and the comparison of gene (collagen II, collagen I, and aggrecan) expression in different culture modes (ii) [91]. ** p < 0.01. Reprinted (adapted) from [91]. Copyright (2015) with permission from Oxford University Press.
Figure 16
Figure 16
Formation of hepatic spheroids by different culture modes, and the comparison of their secretion of albumin and urea [92]. (A) Culture of spheroids by mono-culture of hepatocytes, co-culture of hepatocytes and hepatic stellate cells, tri-culture of hepatocytes, hepatic stellate cells and sinusoidal endothelial cells over time. Black scale bars: 100 µm, red scale bars: 50 µm. (B) Different spheroids with serum albumin (red), CYP450 reductase (green) and nuclei (blue) stained (left), and the secretion of albumin (middle) and urea with time (right). * p < 0.05, ** p < 0.01, *** p < 0.001. Scale bars: 50 µm. Reprinted (adapted) from [92]. Copyright (2014) with permission from Elsevier.
Figure 17
Figure 17
Formation of neurosphere and neural network [94]. (A) The schematic view showing the different layers of cortical region of prenatal rat (left), the procedures of neurosphere formation in concave microwells (right: a), the schematic of the network of neurospheres (right: b), and the pictures of neurospheres stained with calcein AM (right: c). Scale bar: 300 µm. (B) Fluorescent pictures of three-dimensional neurosphere and cryosectioned neurosphere stained against various transcription factors. Different transcription factors are specific to different layers of the cortical region: Brn2 and Satb2 corresponded to layers II-IV, CTIP2 corresponded to layer V, and Tbr1 corresponded to layer VI. Scale bar: 100 µm. Reprinted (adapted) from [94]. Copyright (2013) with permission from Elsevier.
Figure 18
Figure 18
Formation of functional islet spheroids by co-culturing islet cells and ADSCs [96]. (A) Bright-field and fluorescent pictures of cell aggregates by mono-culture and co-culture of islet cells and ADSCs. Scale bar: 200 µm. (B) Morphology change of co-cultures of islet cells and ADSCs (upper) which is indicated by ’+’ and ’−’, and the schematic of the detachment of ADSCs from cell aggregates of islet cells and ADSCs (lower). (C) Intact islets and spheroids formed by mono-culture and co-culture, which were stained by live/dead assay. Scale bars: 100 µm. (D) Comparison of cell viability of intact islets and spheroids by mono-culture and co-culture. * p < 0.01, ** p < 0.001. Reprinted (adapted) from [96]. Copyright (2014) with permission from Elsevier.
Figure 19
Figure 19
Formation of hybrid spheroids by culturing hepatocytes and islet single cells together [97]. (A) The schematic view of the formation of hybrid spheroids by hepatocytes and islet single cells. (B) Pictures of mono-culture of islet single cells (left), hepatocytes (right) and co-culture of islet single cells and hepatocytes (middle), in which the green fluorescence indicates the live cells. Scale bars: 500 µm. (C) SEM pictures of spheroids of mono-culture of islet single cells (left), hepatocytes (right) and co-culture of islet single cells and hepatocytes (middle). Scale bars: 20 µm. (D) Results of Cell Counting Kit-8 (CCK-8) applied to spheroids with different mixing ratios of hepatocytes and islet single cells on day 1 and day 7 (left), and normalized viability of cells in different spheroids on day 7 versus day 1 (right). * p < 0.05, ** p < 0.01, *** p < 0.001. Reprinted (adapted) from [97]. Copyright (2013) with permission from Elsevier.
Figure 20
Figure 20
Formation of embryoid bodies in deep concave microwells [98]. (A) Cross-section view of embryoid stem cell aggregates in concave microwells (i), and top view of embryoid stem cell aggregates (ii). Scale bars: 400 µm. (B) Fluorescent images of embryoid bodies with green indicating the live cells (a), the relation of embryoid body size with the width of microwell and the seeding density (b), fluorescent images of embryoid bodies with sarcomeric a-actinin and nucleus stained to show the cardiac differentiation (c), fluorescent images of embryoid bodies with neurofilament, nestin, and nucleus stained to show the neuroepithelial differentiation (d). ** p < 0.01. Scale bar in (a) shows 300 µm, and scale bars in (c) and (d) show 400 µm. Reprinted (adapted) from [98]. Copyright (2012) with permission from Royal Society of Chemistry.
Figure 21
Figure 21
Formation of tonsil-derived mesenchymal stem cells (dTMSC) spheroids and their application in parathyroid tissue engineering [100]. (A) The schematic view of experimental procedures: at first, TMSCs were isolated from tonsils and then cultured in concave microwells; secondly, three different types of TMSC spheroids were formed under different culture conditions; thirdly, two types of TMSC spheroids were implanted into PTX rats to check their potential in hypoparathyroidism. (B) Three different types of TMSC spheroids: SP1 refers to the spheroids formed by culturing TMSCs in control medium for 14 days, SP2 refers to the spheroids formed by culturing TMSCs in control medium for the first 7 days and differentiation medium for the second 7 days, and SP3 refers to the spheroids formed by culturing TMSCs in differentiation medium for 14 days. (C) The viability of TMSCs in SP1, SP2, and SP3, respectively. (D) Fluorescent pictures of SP1 (left), SP2 (middle), and SP3 (right) stained by a live/dead assay, in which the green indicates the live cells and the red indicates the dead cells. (E) The comparison of survival rate (left), body weight change (middle) and serum iCa2+ concentration (right) of PTX rats implanted with SP1 and SP2 in 90 days. PBS served as a negative control. Sham refers to rats with sham operation but no spheroid implantation.
Figure 22
Figure 22
Formation of embryoid bodies and procedures of determination of optimal induction condition [48]. At first, hESCs were seeded into concave microwells to form embryoids. Then, these embryoids were treated by mesoderm inducer BMP4 after mesoderm lineage induction. Lastly, the distribution of platelet endothelial cell adhesion molecule (PECAM) was checked to evaluate the effect of BMP4.
Figure 23
Figure 23
The behavior of cells in concave microwells. (A) 4 h after the seeding of L929 cells on the PDMS substrate with concave microwells (a), fluorescent images of L929 cells after three days of culture (b), the distribution of cells inside and outside of concave microwells in 4 h and 3 days after seeding (c), fluorescent images of human mesenchymal stem cells (hMSCs) cultured on PDMS substrate with concave microwells, of which the focus plane is on the flat plane (d) and concave microwells (e) respectively, the pattern of cells close to the microwells (f), and the status of L929 cells after three-day culture on the substrate with concave microwells (g) [69]. * p < 0.01. Scale bars: 100 µm. (B) Comparison of cell velocity on concave and flat surfaces [69]. ‘*’ indicates a significant difference (p = 0.034). Reprinted (adapted) from [69]. Copyright (2009) with permission from Royal Society of Chemistry. (C) Schematic side view (a) and top view (b) of primary human colonic epithelial cell culture in microwells with different shapes, fluorescent images of cells cultured on different bases (c–e), and the comparison of 5-ethynyl-2-deoxyuridine (EdU) fluorescence of cells cultured on different bases (f) [102]. * p < 0.001. Reprinted (adapted) from [102]. Copyright (2021) with permission from IOP Publishing.

Similar articles

Cited by

References

    1. Zhang B., Korolj A., Lai B.F.L., Radisic M. Advances in organ-on-a-chip engineering. Nat. Rev. Mater. 2018;3:257–278. doi: 10.1038/s41578-018-0034-7. - DOI
    1. Skardal A., Shupe T., Atala A. Organoid-on-a-chip and body-on-a-chip systems for drug screening and disease modeling. Drug Discov. Today. 2016;21:1399–1411. doi: 10.1016/j.drudis.2016.07.003. - DOI - PMC - PubMed
    1. Huh D., Matthews B.D., Mammoto A., Montoya-Zavala M., Hsin H.Y., Ingber D.E. Reconstituting organ-level lung functions on a chip. Science. 2010;328:1662–1668. doi: 10.1126/science.1188302. - DOI - PMC - PubMed
    1. Agarwal A., Goss J.A., Cho A., McCain M.L., Parker K.K. Microfluidic heart on a chip for higher throughput pharmacological studies. Lab Chip. 2013;13:3599–3608. doi: 10.1039/c3lc50350j. - DOI - PMC - PubMed
    1. Deng J., Cong Y., Han X., Wei W., Lu Y., Liu T., Zhao W., Lin B., Luo Y., Zhang X. A liver-on-a-chip for hepatoprotective activity assessment. Biomicrofluidics. 2020;14:064107. doi: 10.1063/5.0024767. - DOI - PMC - PubMed

LinkOut - more resources