. 2022 Aug 23;10(9):1690.
doi: 10.3390/microorganisms10091690.

Seasonal Dynamics of Lake Winnipeg's Microbial Communities Reveal Aerobic Anoxygenic Phototrophic Populations Coincide with Sunlight Availability

Affiliations

Seasonal Dynamics of Lake Winnipeg's Microbial Communities Reveal Aerobic Anoxygenic Phototrophic Populations Coincide with Sunlight Availability

Steven B Kuzyk et al. Microorganisms. .

Abstract

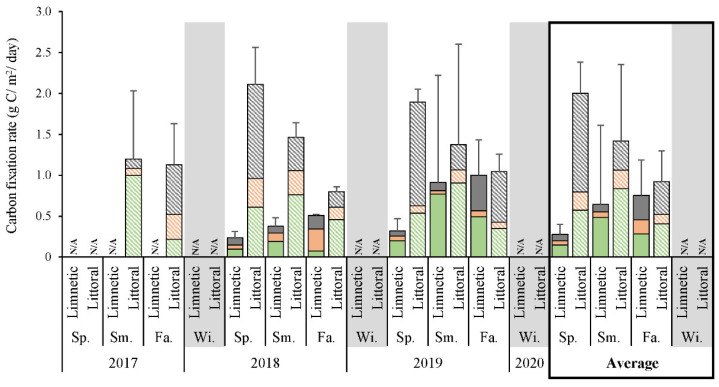
In this first comprehensive study of Lake Winnipeg's microbial communities, limnetic and littoral euphotic zones were examined during each season from 2016 through 2020. Classical cultivation and modern high-throughput sequencing techniques provided quantification and identification of key phototrophic populations, including aerobic anoxygenic phototrophs (AAP). Annual dynamics found total heterotrophs reached 4.23 × 10⁶ CFU/g in littoral sands, and 7.69 × 10⁴ CFU/mL in summer littoral waters on oligotrophic media, higher counts than for copiotrophic compositions. Limnetic numbers inversely dipped to 4.34 × 10³ CFU/mL midsummer. Cultured AAP did not follow heterotrophic trends, instead peaking during the spring in both littoral and limnetic waters as 19.1 and 4.7% of total copiotrophs, or 3.9 and 4.9% of oligotrophs, decreasing till autumn each year. Complementary observations came from environmental 16S V4 rRNA gene analysis, as AAP made up 1.49 and 1.02% of the littoral and limnetic sequenced communities in the spring, declining with seasonal progression. Spatial and temporal fluctuations of microbes compared to environmental factors exposed photosynthetic populations to independently and regularly fluctuate in the ecosystem. Oxygenic phototrophic numbers expectantly matched the midsummer peak of Chl a and b, oxygenic photosynthesis related carbon fixation, and water temperature. Independently, AAP particularly colonized spring littoral areas more than limnetic, and directly corresponded to habitat conditions that specifically promoted growth: the requirement of light and organic material.

Keywords: Lake Winnipeg; aerobic anoxygenic phototrophs; bacterial community; bacterioplankton; food web dynamics; microbial ecology of lakes; picoplankton.


Conflict of interest statement

The authors declare no conflict of interest.

Figures

Figure A1
Figure A1
Photosynthesis primary pigment levels from each sampling location. Solvent extracts of collected biomass revealed BChl a, Chl a, and Chl b concentrations at limnetic (blue) or littoral (light green) zones. N/A, not analyzed; n, number of samples per season.
Figure 1
Figure 1
Lake Winnipeg seasonal progression and sampling locations. (A) Map of the South Basin of Lake Winnipeg, with littoral (green) and limnetic (blue) sites selected for study: S1–5, S6–10 (W1, W6, and W8 alternatively), respectively; Scale bar, 10 km. Satellite images of entire waterbody depicting seasonal change to lake habitat and surrounding lands during (B) Winter, 26 March 2017 indicating additional under-ice sites, (C) Spring, 31 May 2017, (D) Summer, 3 August 2017, and (E) Fall, 11 October 2017; Scale bars, 40 km. Photographs provided by Dr. K. Scott and the Lake Winnipeg Research Consortium (LWRC), in partnership with the Rapid Response Imagery from the Land Atmosphere Near-real time Capability for EOS (LANCE) system operated by the NASA/GSFC/Earth Science Data and Information System (ESDIS).
Figure 2
Figure 2
Periodic fluctuations of lake environmental parameters. Average light availability, water temperature and pH for all limnetic (blue bars) or littoral (light green bars) samples depicted for each season. N/A, not analyzed; n, number of samples per season.
Figure 3
Figure 3
Primary productivity of Lake Winnipeg. 14C fixation measured in situ with total rates composed of oxygenic (green) or anoxygenic (orange) photosynthesis related fixation, and from dark chemosynthetic reactions (grey bars). N/A, not analyzed; Sp., Spring; Sm., Summer; Fa., Fall; Wi., Winter.
Figure 4
Figure 4
Enumeration of heterotrophs and AAP through all seasons and years. (A) Counts of total cultured heterotrophs from limnetic water (blue), littoral water (green), or sediment (orange) samples on copiotrophic RO (dark colors) or oligotrophic OM (lighter shade of each). (B) Copiotrophic and (C) oligotrophic AAP proportions of pigmented colonies (light shade) and total counts (dark shade) of seasonal averages from 2016–2020. N/A, not analyzed; Sp., Spring; Sm., Summer; Fa., Fall; Wi., Winter.
Figure 5
Figure 5
Bacterial community composition based on sequenced 16S V4 rRNA genes. (A) Phyla in water samples defined at limnetic vs. littoral sites. Minimal clades represented less than 1% per community with Firmicutes, Deinococcota, Bdellovibrionota, Crenarchaeota, Desulfobacterota, Hydrogenedentes, Margulisbacteria, Myxococcota, Sumerlaeota, SAR324, MBNT15, and NB1-j clades. (B) Total α-diversity of bacteria from limnetic water (blue), littoral water (green), or sediments (orange). (C,D) PCoA ordination based on Jaccard diversity distance matrix with percent variation as principal coordinates split on indicated axis. (C) From above axis 1 and 3 separate seasons, while (D) depicts major shift occurring along axis 2 by year with ellipses as visual cues. N/A, not analyzed; n, number of samples per season; Sp., Spring; Sm., Summer; Fa., Fall; Wi., Winter.
Figure 6
Figure 6
Relative proportions of phototrophs in sequenced communities. All 16S V4 rRNA genes of species and genera representing AAP, AOP, or AnAnP at limnetic (blue) and littoral (green) sites summed for each season. N/A, not analyzed; n, number of samples per season.

References

    1. Reed A.J., Hicks R.E. Microbial ecology of Lake Superior Bacteria and Archaea: An overview. Aquat. Ecosyst. Health Manag. 2011;14:386–395. doi: 10.1080/14634988.2011.630282. - DOI
    1. Mou X., Jacob J., Lu X., Robbins S., Sun S., Ortiz J.D. Diversity and distribution of free-living and particle-associated bacterioplankton in Sandusky Bay and adjacent waters of Lake Erie Western Basin. J. Great Lakes Res. 2013;39:352–357. doi: 10.1016/j.jglr.2013.03.014. - DOI
    1. Nakatsu C.H., Byappanahalli M.N., Nevers M.B. Bacterial Community 16S rRNA Gene Sequencing Characterizes Riverine Microbial Impact on Lake Michigan. Front. Microbiol. 2019;10:996. doi: 10.3389/fmicb.2019.00996. - DOI - PMC - PubMed
    1. Paver S.F., Newton R.J., Coleman M.L. Microbial communities of the Laurentian Great Lakes reflect connectivity and local biogeochemistry. Environ. Microbiol. 2020;22:433–446. doi: 10.1111/1462-2920.14862. - DOI - PMC - PubMed
    1. Evans M. The large lake ecosystems of northern Canada. Aquat. Ecosyst. Health Manag. 2000;3:65–79. doi: 10.1080/14634980008656992. - DOI

LinkOut - more resources