. 2022 Aug 23;10(9):1691.
doi: 10.3390/microorganisms10091691.

Effect of a Stannous Fluoride Dentifrice on Biofilm Composition, Gene Expression and Biomechanical Properties

Affiliations

Effect of a Stannous Fluoride Dentifrice on Biofilm Composition, Gene Expression and Biomechanical Properties

Hardeep Kaur Gumber et al. Microorganisms. .

Abstract

An in situ study was conducted to examine the mode of action of a 0.454% stannous fluoride (SnF2)-containing dentifrice in controlling the composition and properties of oral biofilm. Thirteen generally healthy individuals participated in the study. Each participant wore an intra-oral appliance over a 48-h period to measure differences in the resulting biofilm's architecture, mechanical properties, and bacterial composition after using two different toothpaste products. In addition, metatranscriptomics analysis of supragingival plaque was conducted to identify the gene pathways influenced. The thickness and volume of the microcolonies formed when brushing with the SnF2 dentifrice were dramatically reduced compared to the control 0.76% sodium monofluorophosphate (MFP)-containing toothpaste. Similarly, the biophysical and nanomechanical properties measured by atomic force microscopy (AFM) demonstrated a significant reduction in biofilm adhesive properties. Metatranscriptomic analysis identified pathways associated with biofilm formation, cell adhesion, quorum sensing, and N-glycosylation that are significantly downregulated with SnF2. This study provides a clinically relevant snapshot of how the use of a stabilized, SnF2 toothpaste formulation can change the spatial organization, nanomechanical, and gene expression properties of bacterial communities.

Keywords: dental plaque; oral biofilm; oral health; oral microbiome; stannous fluoride; toothpaste.


Conflict of interest statement

H.K.G., A.S.L., K.I.F., K.M. and L.K.-L. are current employees of Colgate-Palmolive. T.S. and R.P. were Colgate-Palmolive employees at the time the study was conducted.

Figures

Figure 1
Figure 1
Photograph of the intra-oral retainer fitted with hydroxyapatite discs.
Figure 2
Figure 2
Schematic of the clinical study design.
Figure 3
Figure 3
Confocal imaging and quantification of in situ biofilms: (A,B) 3D volume views of 2-day in situ biofilms formed with sodium mnofluorophosphate (MFP) and SnF2-containing toothpaste use for 14 days. (C,D) Plots of biofilm volume and thickness formed with MFP and Colgate Total SnF2 use. Three to four data points were collected for each panelist for each condition. The squares/points represent average value for each panelist per condition and bars represent average value of the data set per condition. The error bars represent standard deviation. The average volume and thickness values are significantly lower in the SnF2 group compared to that of MFP (* p < 0.00001, paired Student t-test).
Figure 4
Figure 4
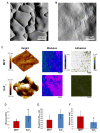
AFM images and quantification. PeakForce Error Images (25 μm × 25 μm) showing the surface of the hydroxyapatite (HAP) disc before (A) and after (B) biofilm growth. (C) HAP disc and biofilm height (left), qualitative modulus map (center) and qualitative adhesion map (right) for sodiummonofluorophosphate (MFP) (top) and SnF2 (bottom) biofilms. (DF) Barplots showing quantitative comparison of Young’s modulus, root mean square height (roughness), and adhesion of MFP and SnF2 biofilms. All grouping information was calculated using Tukey method and 95% confidence interval, with asterisks indicating statistical significance with p < 0.05.
Figure 5
Figure 5
Oral bacterial community composition with the use of sodium monofluorophosphaste (MFP) and SnF2-containing toothpastes. Stacked bar plots showing relative abundance of taxa at phylum (A), genus (top 10) (B), and species (top 25) (C) levels in biofilms formed with MFP and SnF2-containing toothpaste use. (D) Plot showing differential abundance of taxa at the genus level. The genera represented higher in MFP and SnF2 biofilms, which are shown on the left and right side of the central line, respectively. Only genera with p < 0.1 are plotted and significantly different genera (p < 0.05) are denoted as asterisks (Wald significance Test).
Figure 6
Figure 6
Diversity measurements of oral bacterial community with the use of sodium monofluorophosphate (MFP) and SnF2-containing toothpastes: (A) Boxplots showing alpha diversity of bacterial communities by observed ASVs and measured Shannon and Simpson indices. Each point in the plot is one sample, top and bottom of the box represent upper and lower quartiles, the line is at median, and bars show 95% confidence interval. (BD) Beta diversity Principal Component Analysis (PCoA) plots showing distances of microbial communities in MFP and SnF2 samples measured using Bray–Curtis, Euclidean, and unweighted-unifrac distance matrices. Each dot represents a sample. R2 and p values calculated by Adonis test for permutational multivariate analysis of variance using distance matrices are shown on the top right of each beta diversity plot.
Figure 7
Figure 7
Non-metric multidimensional scaling (NMDS) plot showing distribution of panelists based on Bray–Curtis dissimilarity matrix calculated from TMM normalized transcript count estimates. Sodium monofluorophosphate (MFP) and SnF2 samples from the same panelist are connected by an arrow.
Figure 8
Figure 8
Volcano plot for differential expression of SnF2 vs. sodium monofluorophosphate (MFP) treatment: points are labeled with KEGG Orthology (n = 7734), grey pointd are not significant, blue have a log2 fold change greater than 3, yellow have a 1-prob < 0.2, and red have both a high fold change and significant probability; fold change and probability cutoffs are marked with dotted lines.
Figure 9
Figure 9
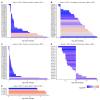
KEGG pathway analysis for the identification of differentially expressed KEGG orthologs. Plots are up to the 30 most significant KOs in each pathway (A) Biofilm formation including KEGG pathways map02025, map02026, and map05111; (B) Cell adhesion molecules pathway map04514; (C) Quorum sensing pathway map02024; (D) Bacterial chemotaxis pathway map02030; and (E) N-glycosylation by oligosaccharyltransferase module M00072.
Figure 10
Figure 10
Plot showing correlation between ranked gene list and toothpaste treatment where ‘1’ represents SnF2 and ‘0’ represents sodium monofluorophosphate (MFP). Out of the 53,290 total genes, 20,902 correlated with SnF2 while 32,388 correlated with MFP.
Figure 11
Figure 11
Heat map showing gene expression values of top genes correlated with SnF2. Range of colors (red, pink, light blue, dark blue) shows the range of expression values (high, moderate, low, lowest).
Figure 12
Figure 12
Heat map showing gene expression values of top genes correlated with sodium monofluorophosphate (MFP). Range of colors (red, pink, light blue, dark blue) shows the range of expression values (high, moderate, low, lowest).

References

    1. Eke P.I., Thornton-Evans G.O., Wei L., Borgnakke W.S., Dye B.A., Genco R.J. Periodontitis in US Adults: National Health and Nutrition Examination Survey 2009–2014. J. Am. Dent. Assoc. 2018;149:576–588. doi: 10.1016/j.adaj.2018.04.023. - DOI - PMC - PubMed
    1. Könönen E., Gursoy M., Gursoy U.K. Periodontitis: A Multifaceted Disease of Tooth-Supporting Tissues. J. Clin. Med. 2019;8:1135. doi: 10.3390/jcm8081135. - DOI - PMC - PubMed
    1. Beck J.D., Papapanou P.N., Philips K.H., Offenbacher S. Periodontal Medicine: 100 Years of Progress. J. Dent. Res. 2019;98:1053–1062. doi: 10.1177/0022034519846113. - DOI - PubMed
    1. Schoen M.H., Freed J.R. Prevention of dental disease: Caries and periodontal disease. Annu. Rev. Public Health. 1981;2:71–92. doi: 10.1146/annurev.pu.02.050181.000443. - DOI - PubMed
    1. Koo H., Yamada K.M. Dynamic cell-matrix interactions modulate microbial biofilm and tissue 3D microenvironments. Curr. Opin Cell. Biol. 2016;42:102–112. doi: 10.1016/j.ceb.2016.05.005. - DOI - PMC - PubMed

LinkOut - more resources