

Investigation of Water Interaction with Polymer Matrices by Near-Infrared (NIR) Spectroscopy
- PMID: 36144616
- PMCID: PMC9504856
- DOI: 10.3390/molecules27185882
Investigation of Water Interaction with Polymer Matrices by Near-Infrared (NIR) Spectroscopy
Abstract
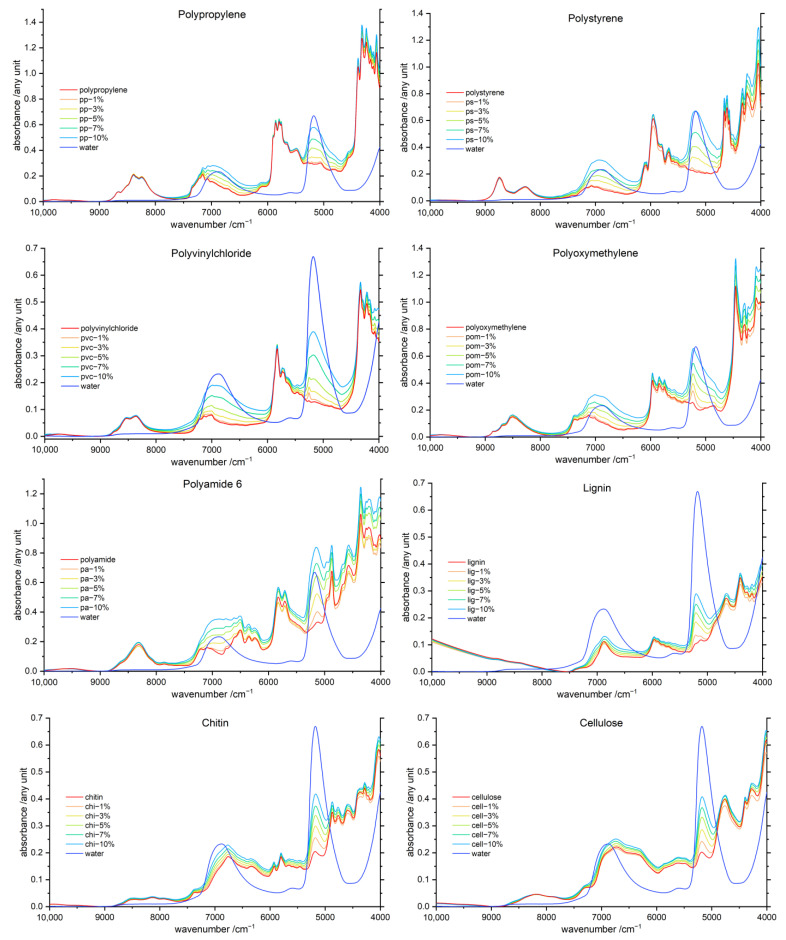
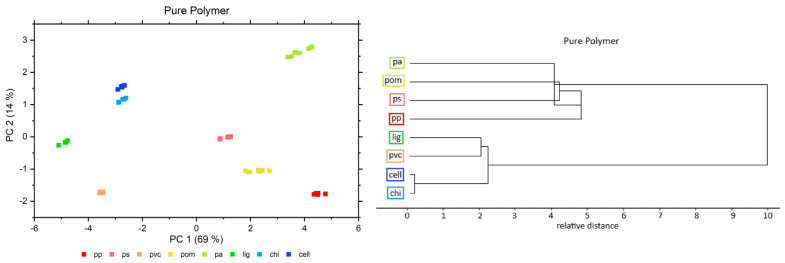
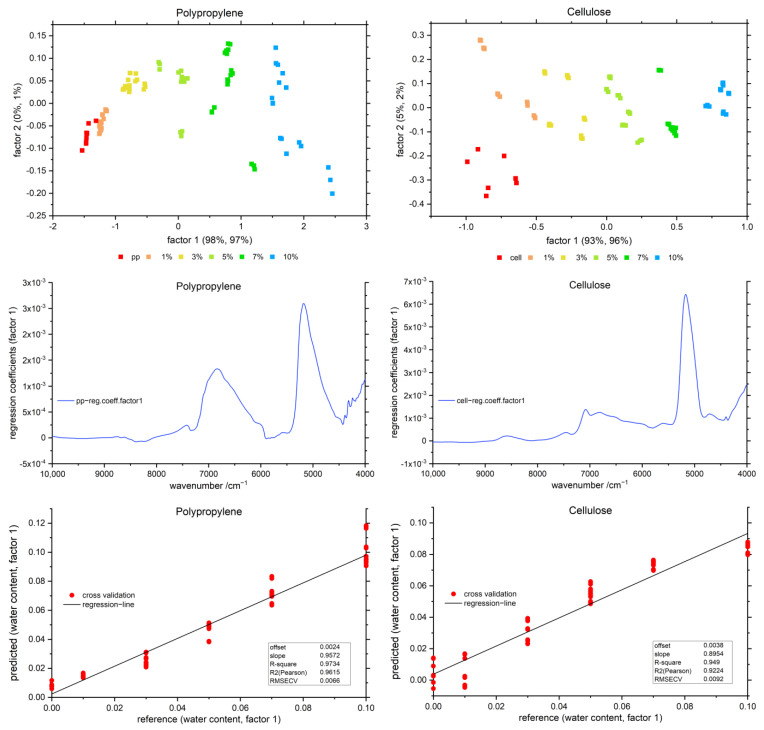
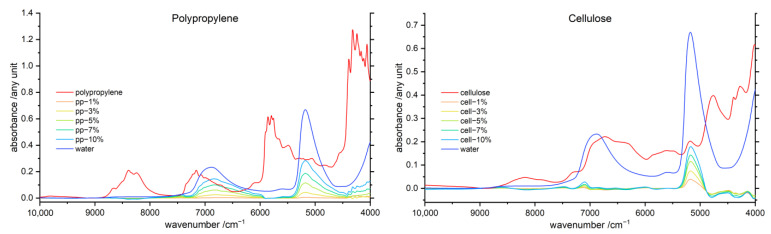
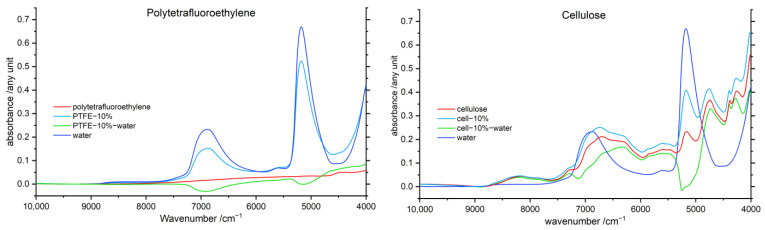
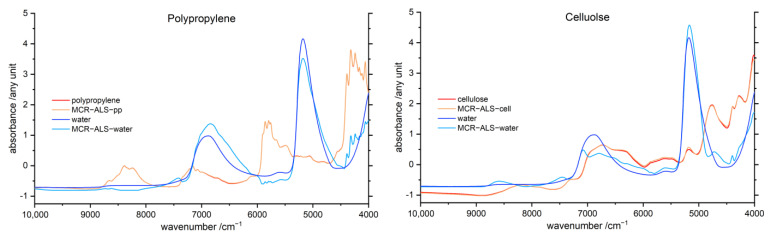
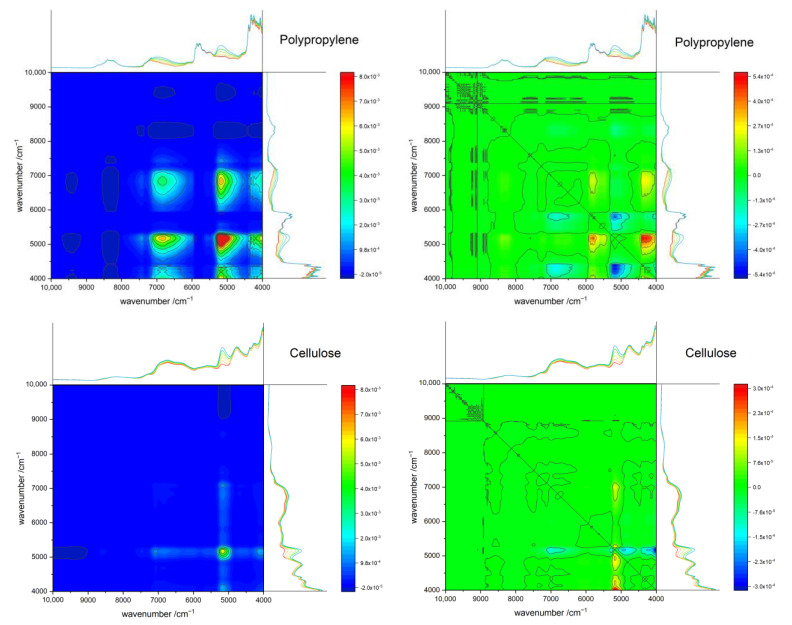
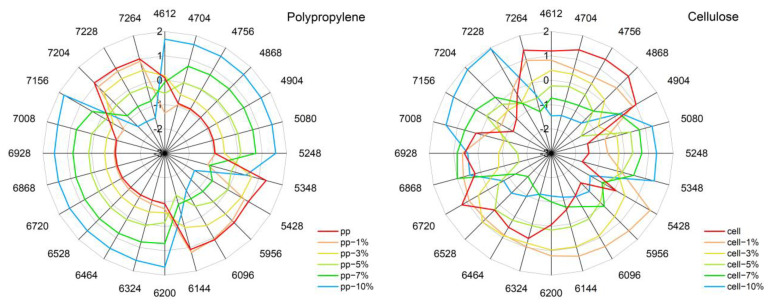
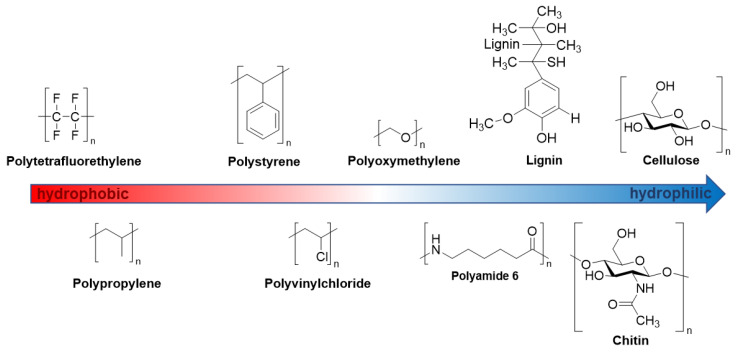
The interaction of water with polymers is an intensively studied topic. Vibrational spectroscopy techniques, mid-infrared (MIR) and Raman, were often used to investigate the properties of water-polymer systems. On the other hand, relatively little attention has been given to the potential of using near-infrared (NIR) spectroscopy (12,500-4000 cm-1; 800-2500 nm) for exploring this problem. NIR spectroscopy delivers exclusive opportunities for the investigation of molecular structure and interactions. This technique derives information from overtones and combination bands, which provide unique insights into molecular interactions. It is also very well suited for the investigation of aqueous systems, as both the bands of water and the polymer can be reliably acquired in a range of concentrations in a more straightforward manner than it is possible with MIR spectroscopy. In this study, we applied NIR spectroscopy to investigate interactions of water with polymers of varying hydrophobicity: polytetrafluoroethylene (PTFE), polypropylene (PP), polystyrene (PS), polyvinylchloride (PVC), polyoxymethylene (POM), polyamide 6 (PA), lignin (Lig), chitin (Chi) and cellulose (Cell). Polymer-water mixtures in the concentration range of water between 1-10%(w/w) were investigated. Spectra analysis and interpretation were performed with the use of difference spectroscopy, Principal Component Analysis (PCA), Median Linkage Clustering (MLC), Partial Least Squares Regression (PLSR), Multivariate Curve Resolution Alternating Least Squares (MCR-ALS) and Two-Dimensional Correlation Spectroscopy (2D-COS). Additionally, from the obtained data, aquagrams were constructed and interpreted with aid of the conclusions drawn from the conventional approaches. We deepened insights into the problem of water bands obscuring compound-specific signals in the NIR spectrum, which is often a limiting factor in analytical applications. The study unveiled clearly visible trends in NIR spectra associated with the chemical nature of the polymer and its increasing hydrophilicity. We demonstrated that changes in the NIR spectrum of water are manifested even in the case of interaction with highly hydrophobic polymers (e.g., PTFE). Furthermore, the unveiled spectral patterns of water in the presence of different polymers were found to be dissimilar between the two major water bands in NIR spectrum (νs + νas and νas + δ).
Keywords: NIR; chemometrics; data analysis; hydrophilic; hydrophobic; near-infrared spectroscopy; polymer; polymer-water interaction; water.
Conflict of interest statement
The authors declare no conflict of interest.
Figures
Similar articles
-
Spectra-structure correlations in NIR region of polymers from quantum chemical calculations. The cases of aromatic ring, C=O, C≡N and C-Cl functionalities.Spectrochim Acta A Mol Biomol Spectrosc. 2021 Dec 5;262:120085. doi: 10.1016/j.saa.2021.120085. Epub 2021 Jun 16. Spectrochim Acta A Mol Biomol Spectrosc. 2021. PMID: 34174679 Free PMC article.
-
Near infrared spectroscopic imaging assessment of cartilage composition: Validation with mid infrared imaging spectroscopy.Anal Chim Acta. 2016 Jul 5;926:79-87. doi: 10.1016/j.aca.2016.04.031. Epub 2016 Apr 25. Anal Chim Acta. 2016. PMID: 27216396 Free PMC article.
-
In silico NIR spectroscopy - A review. Molecular fingerprint, interpretation of calibration models, understanding of matrix effects and instrumental difference.Spectrochim Acta A Mol Biomol Spectrosc. 2022 Oct 15;279:121438. doi: 10.1016/j.saa.2022.121438. Epub 2022 May 28. Spectrochim Acta A Mol Biomol Spectrosc. 2022. PMID: 35667136 Review.
-
Identification Performance of Different Types of Handheld Near-Infrared (NIR) Spectrometers for the Recycling of Polymer Commodities.Appl Spectrosc. 2018 Sep;72(9):1362-1370. doi: 10.1177/0003702818777260. Epub 2018 Jun 1. Appl Spectrosc. 2018. PMID: 29855195
-
Near-Infrared Spectroscopy in Bio-Applications.Molecules. 2020 Jun 26;25(12):2948. doi: 10.3390/molecules25122948. Molecules. 2020. PMID: 32604876 Free PMC article. Review.
Cited by
-
Aquaphotomics-Exploring Water Molecular Systems in Nature.Molecules. 2023 Mar 14;28(6):2630. doi: 10.3390/molecules28062630. Molecules. 2023. PMID: 36985601 Free PMC article.
References
-
- Hatakeyama H., Hatakeyama T. Interaction between water and hydrophilic polymers. Thermochim. Acta. 1998;308:3–22. doi: 10.1016/S0040-6031(97)00325-0. - DOI
-
- Hsu S.L., Patel J., Zhao W. Molecular Characterization of Polymers. Elsevier; Amsterdam, The Netherlands: 2021. Vibrational spectroscopy of polymers; pp. 369–407.
-
- Jellinek H.H.G., editor. Water Structure at the Water-Polymer Interface: Proceedings of a Symposium held on March 30 and April 1, 1971, at the 161st National Meeting of the American Chemical Society. Springer US; Boston, MA, USA: 1972.
MeSH terms
Substances
Grants and funding
LinkOut - more resources
Full Text Sources
Research Materials
Miscellaneous
